research · March 03, 2024 · 7 min read
Deploying the ELK Stack
I wanted one place to look at my network logs instead of jumping between tools. So I set up an ELK stack to centralize and visualize them. Snort and Suricata feed in as sources, and a Windows machine sends its events through Winlogbeat.
ELK is three tools: Elasticsearch indexes and searches, Logstash collects and transforms logs, and Kibana visualizes them.
Provisioning with Vagrant
I use Vagrant to provision the machine. The whole infrastructure lives in one file, so rebuilding everything is just vagrant up.
Vagrant.configure("2") do |config|  config.vm.box = "ubuntu/jammy64"
  config.vm.network "private_network", ip: "192.168.56.10"  config.vm.network "public_network", bridge: "wlan0", ip: "192.168.1.70"
  config.vm.synced_folder ".", "/vagrant", disabled: false  config.vm.synced_folder "./pipelines", "/etc/logstash/conf.d", disabled: false
  config.vm.provider "virtualbox" do |vb|    vb.gui = false    vb.memory = "5192"  end
  config.vm.provision "shell", inline: <<-SHELL
    apt-get update
    # Add the Elastic repository    wget -qO - https://artifacts.elastic.co/GPG-KEY-elasticsearch | sudo gpg --dearmor -o /usr/share/keyrings/elasticsearch-keyring.gpg    sudo apt-get install -y apt-transport-https    echo "deb [signed-by=/usr/share/keyrings/elasticsearch-keyring.gpg] https://artifacts.elastic.co/packages/8.x/apt stable main" | sudo tee /etc/apt/sources.list.d/elastic-8.x.list    sudo apt-get update
    # Elasticsearch    sudo apt-get install -y elasticsearch    printf -- "-Xms1g\n-Xmx1g\n" | sudo tee /etc/elasticsearch/jvm.options.d/heap.options    sudo systemctl enable --now elasticsearch
    # Kibana    sudo apt-get install -y kibana    echo "--max-old-space-size=512" | sudo tee -a /etc/kibana/node.options    sed -i 's|#server.host: "localhost"|server.host: "0.0.0.0"|g' /etc/kibana/kibana.yml    sed -i 's|#server.port: 5601|server.port: 5601|g' /etc/kibana/kibana.yml    sudo systemctl enable --now kibana
    # Logstash    sudo apt-get install -y logstash    sed -i 's|^-Xms.*|-Xms1g|; s|^-Xmx.*|-Xmx1g|' /etc/logstash/jvm.options    sudo systemctl enable --now logstash
  SHELLend
The ./pipelines folder is synced with /etc/logstash/conf.d on the VM. I edit pipelines locally and the VM sees the changes right away.
Start the VM and connect:
vagrant upvagrant ssh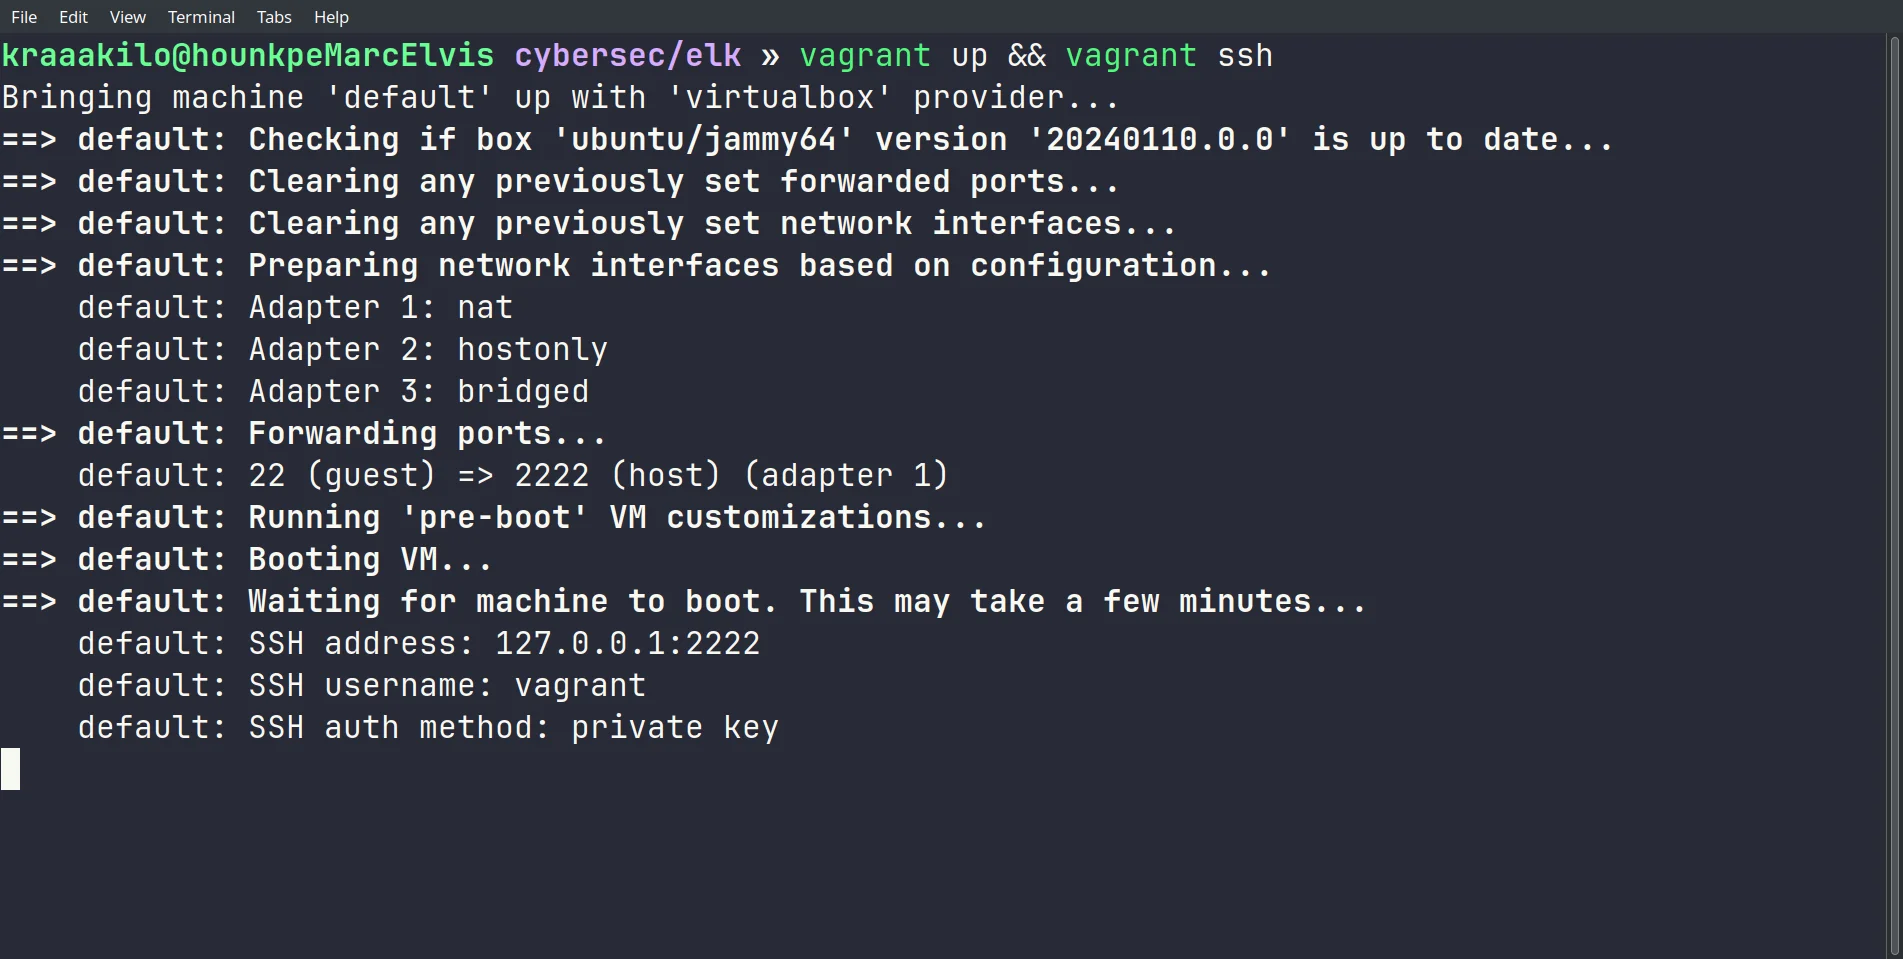
Configuring Snort
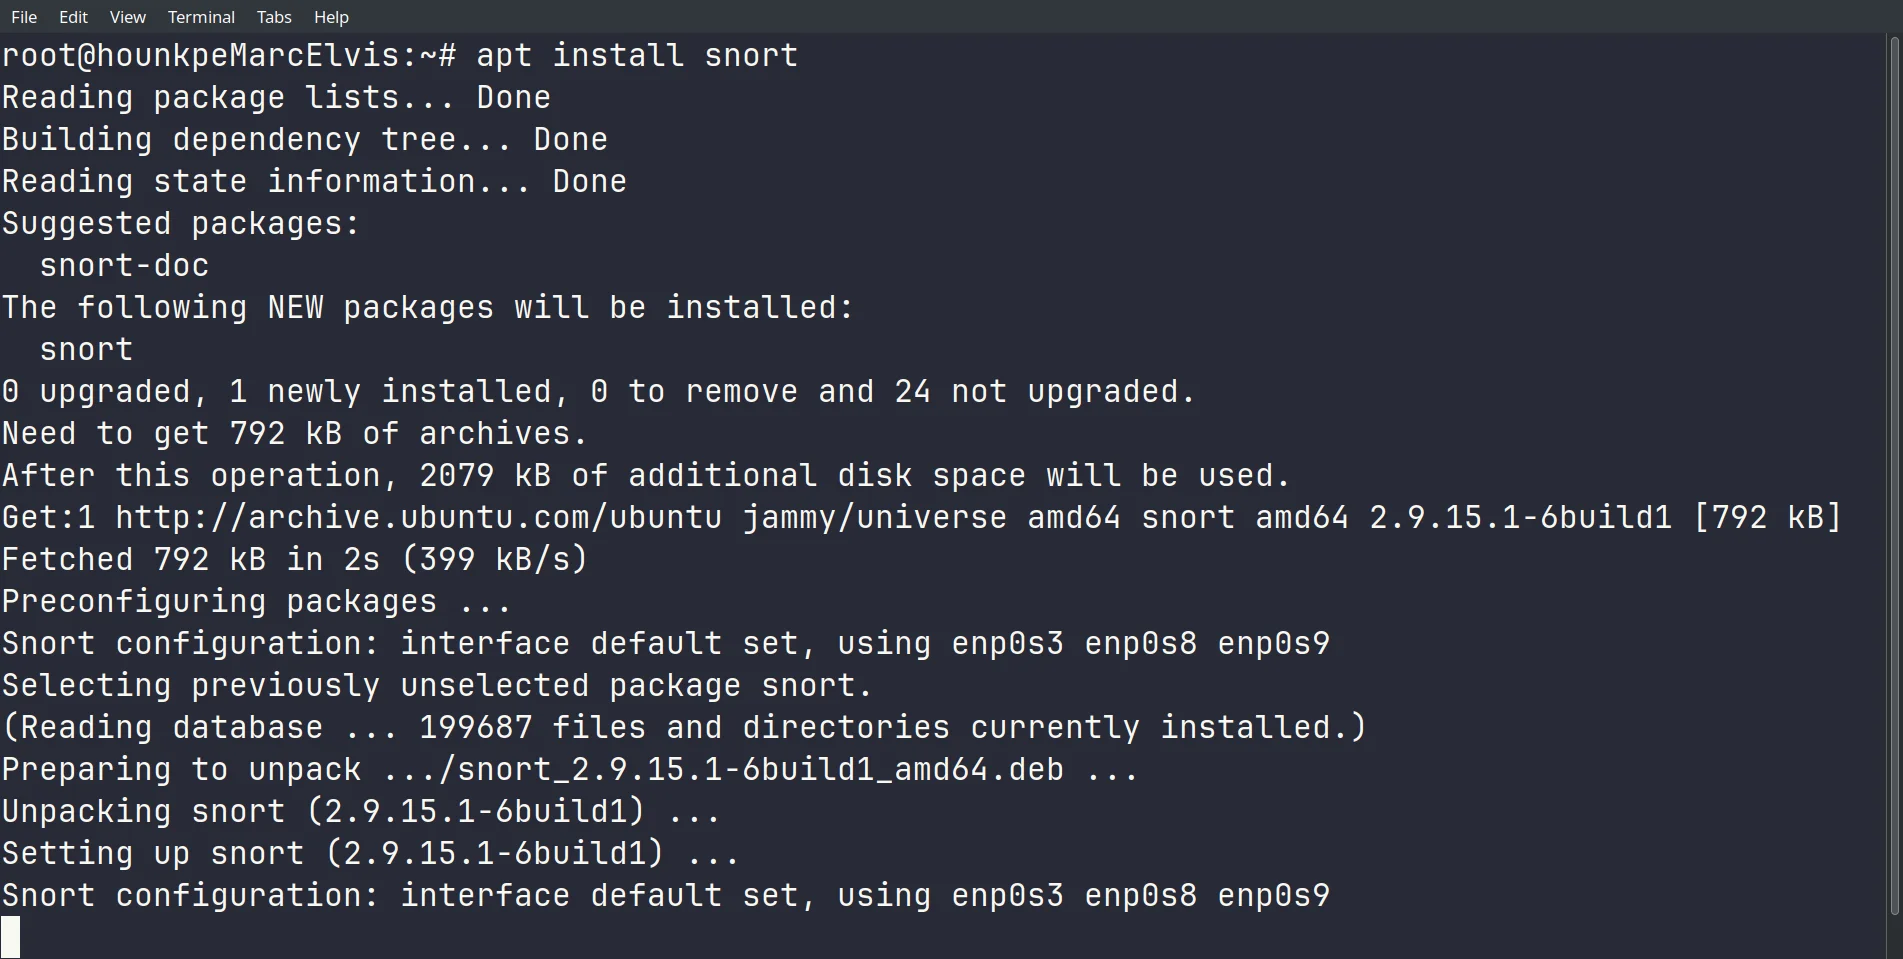
Once Snort is installed, its interactive setup walks through the configuration.
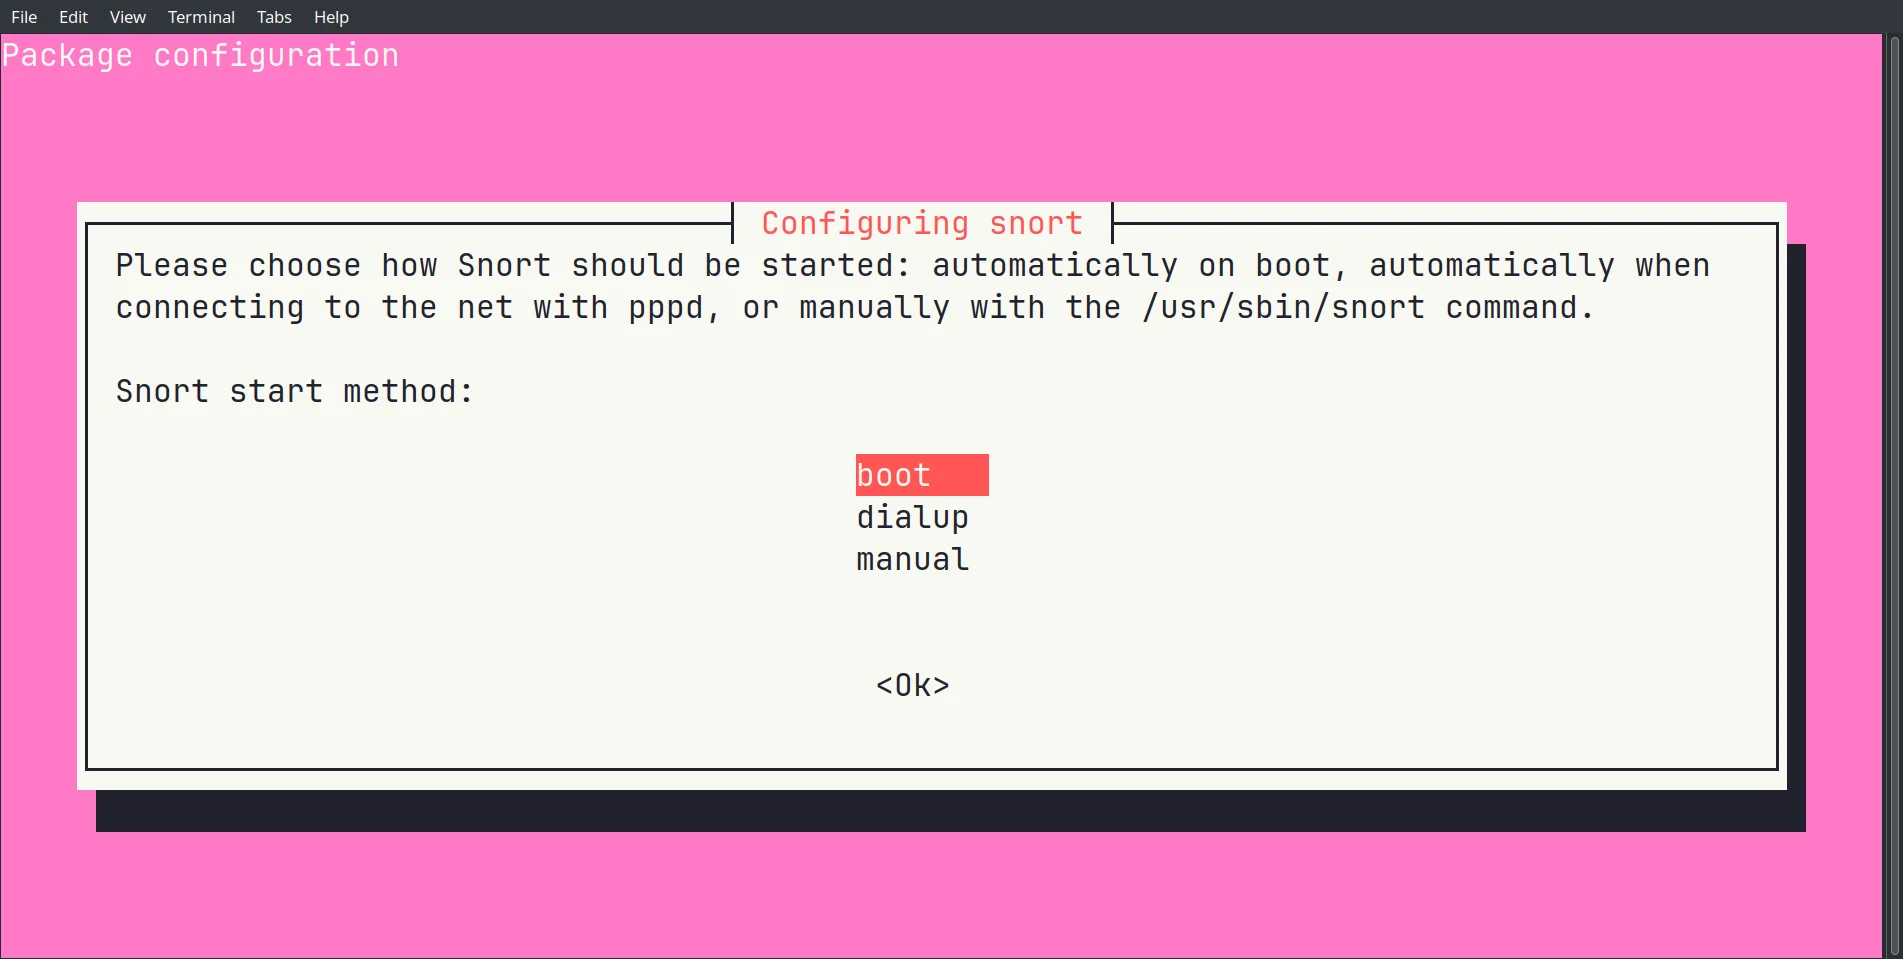
I start Snort at boot so I don’t have to restart the service by hand.
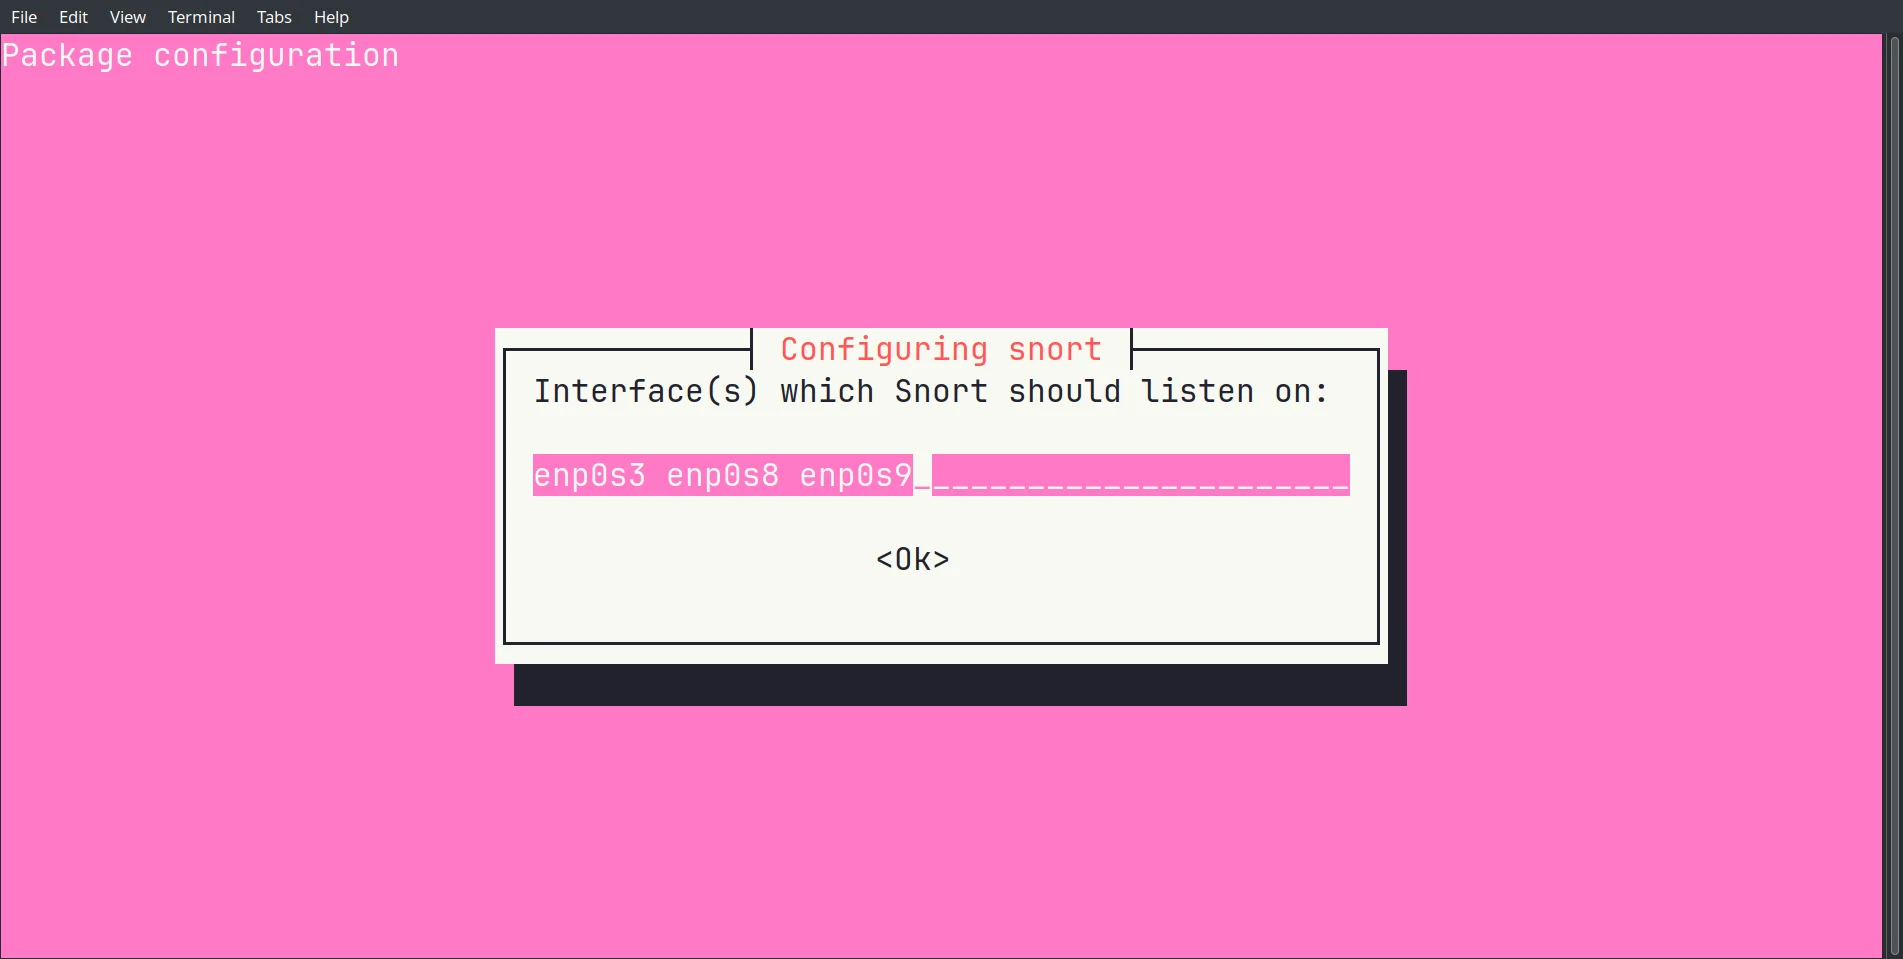
Next, the interfaces Snort listens on. I take all three to cover all relevant traffic.
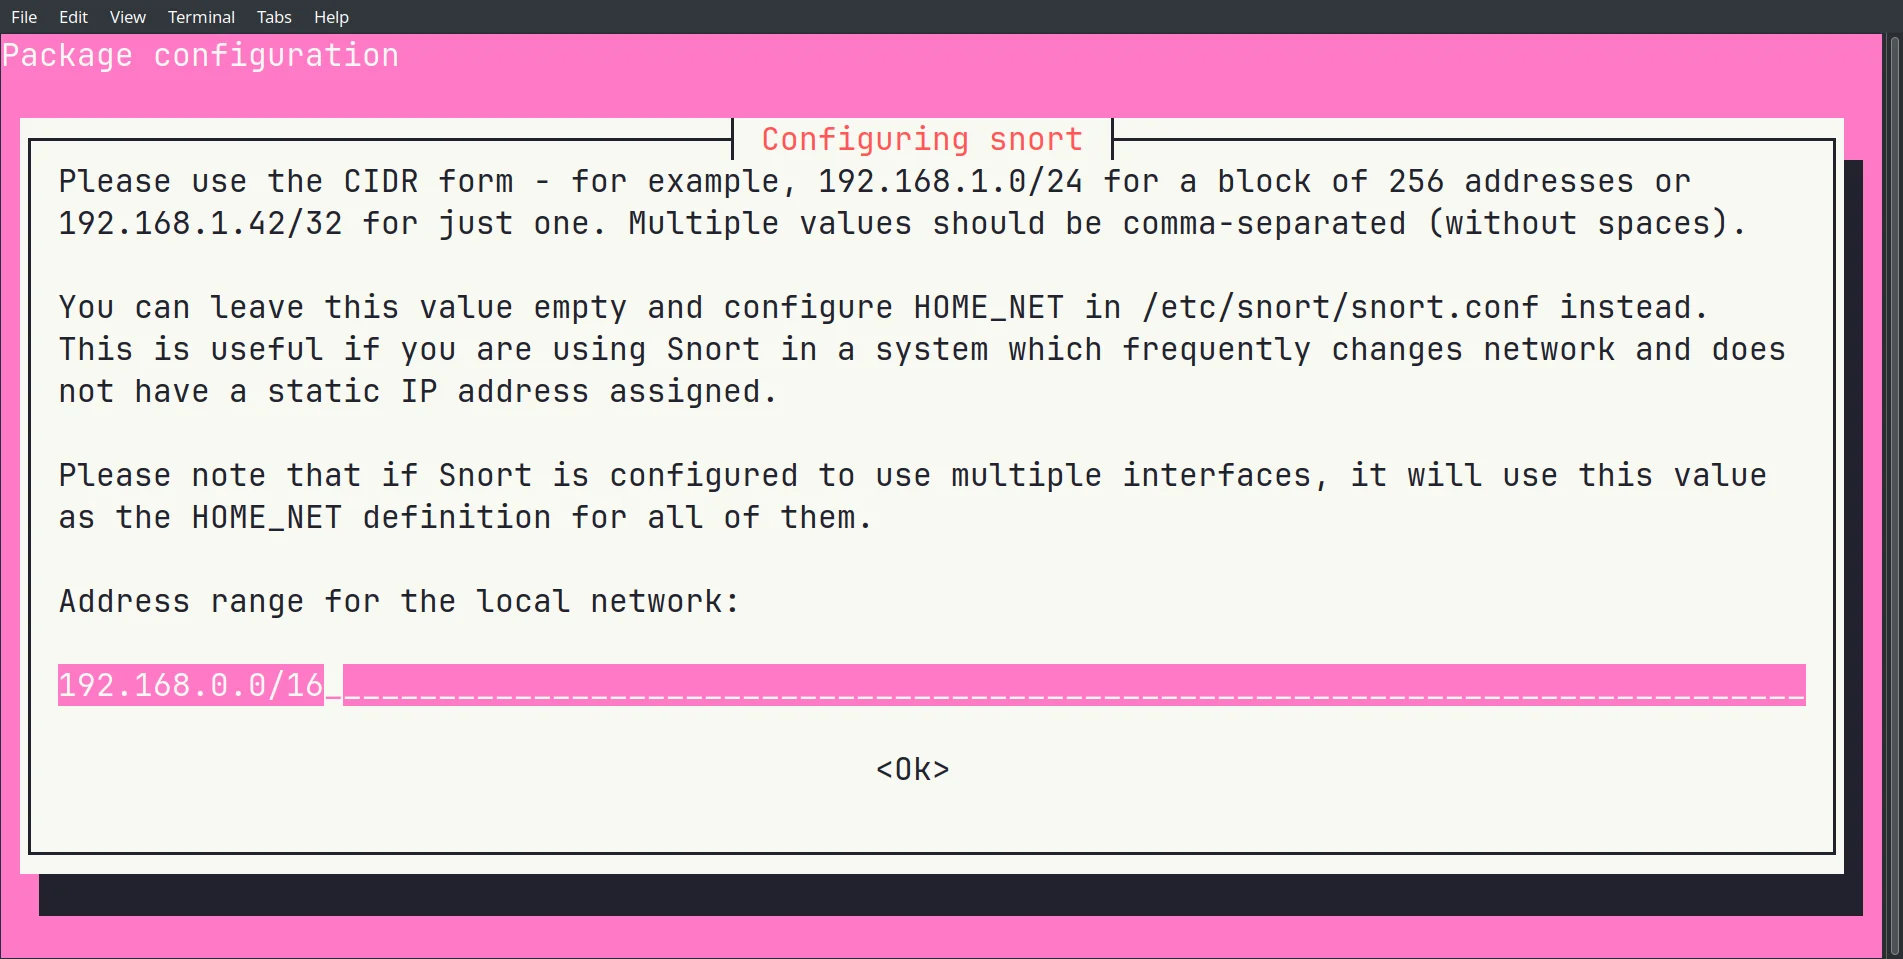
For the address range in CIDR notation, I use 192.168.0.0/16 to cover the whole local network.
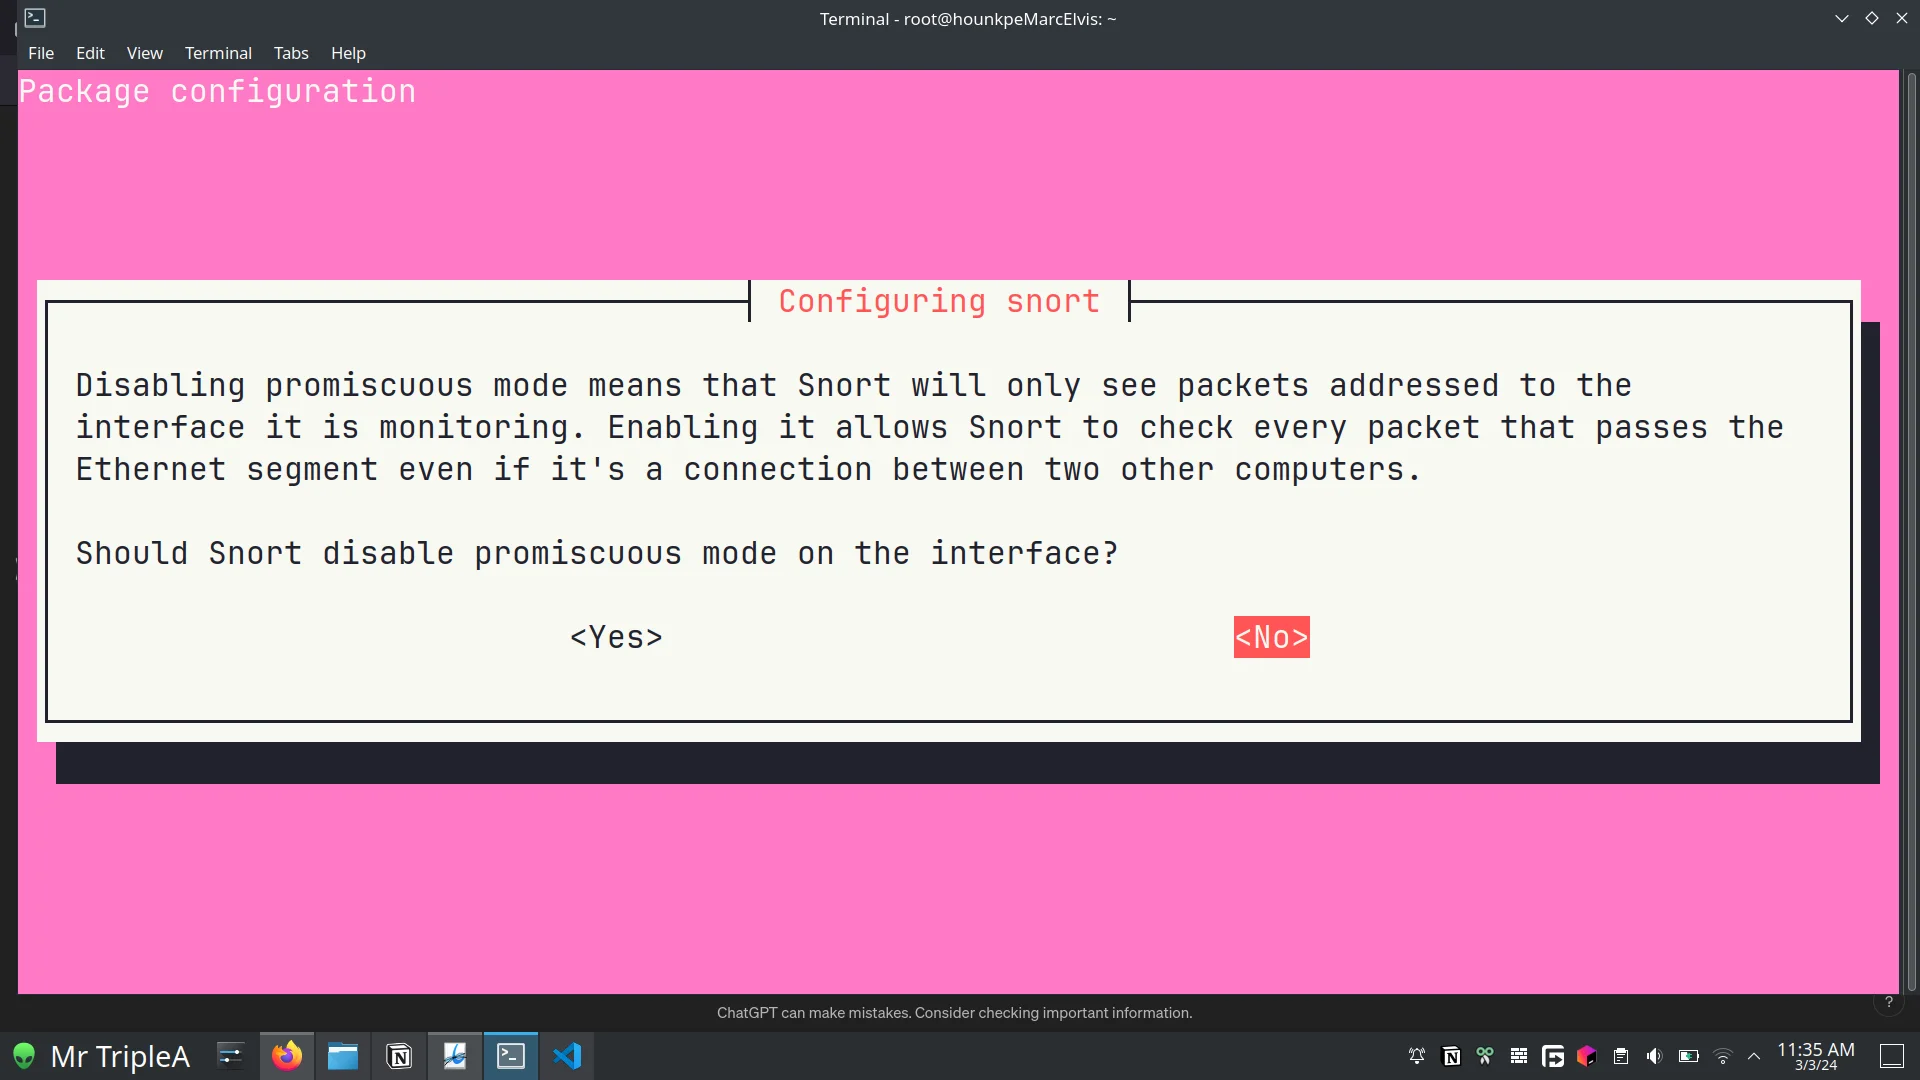
I enable promiscuous mode, so Snort captures all traffic on the network segment, not only packets addressed to it.
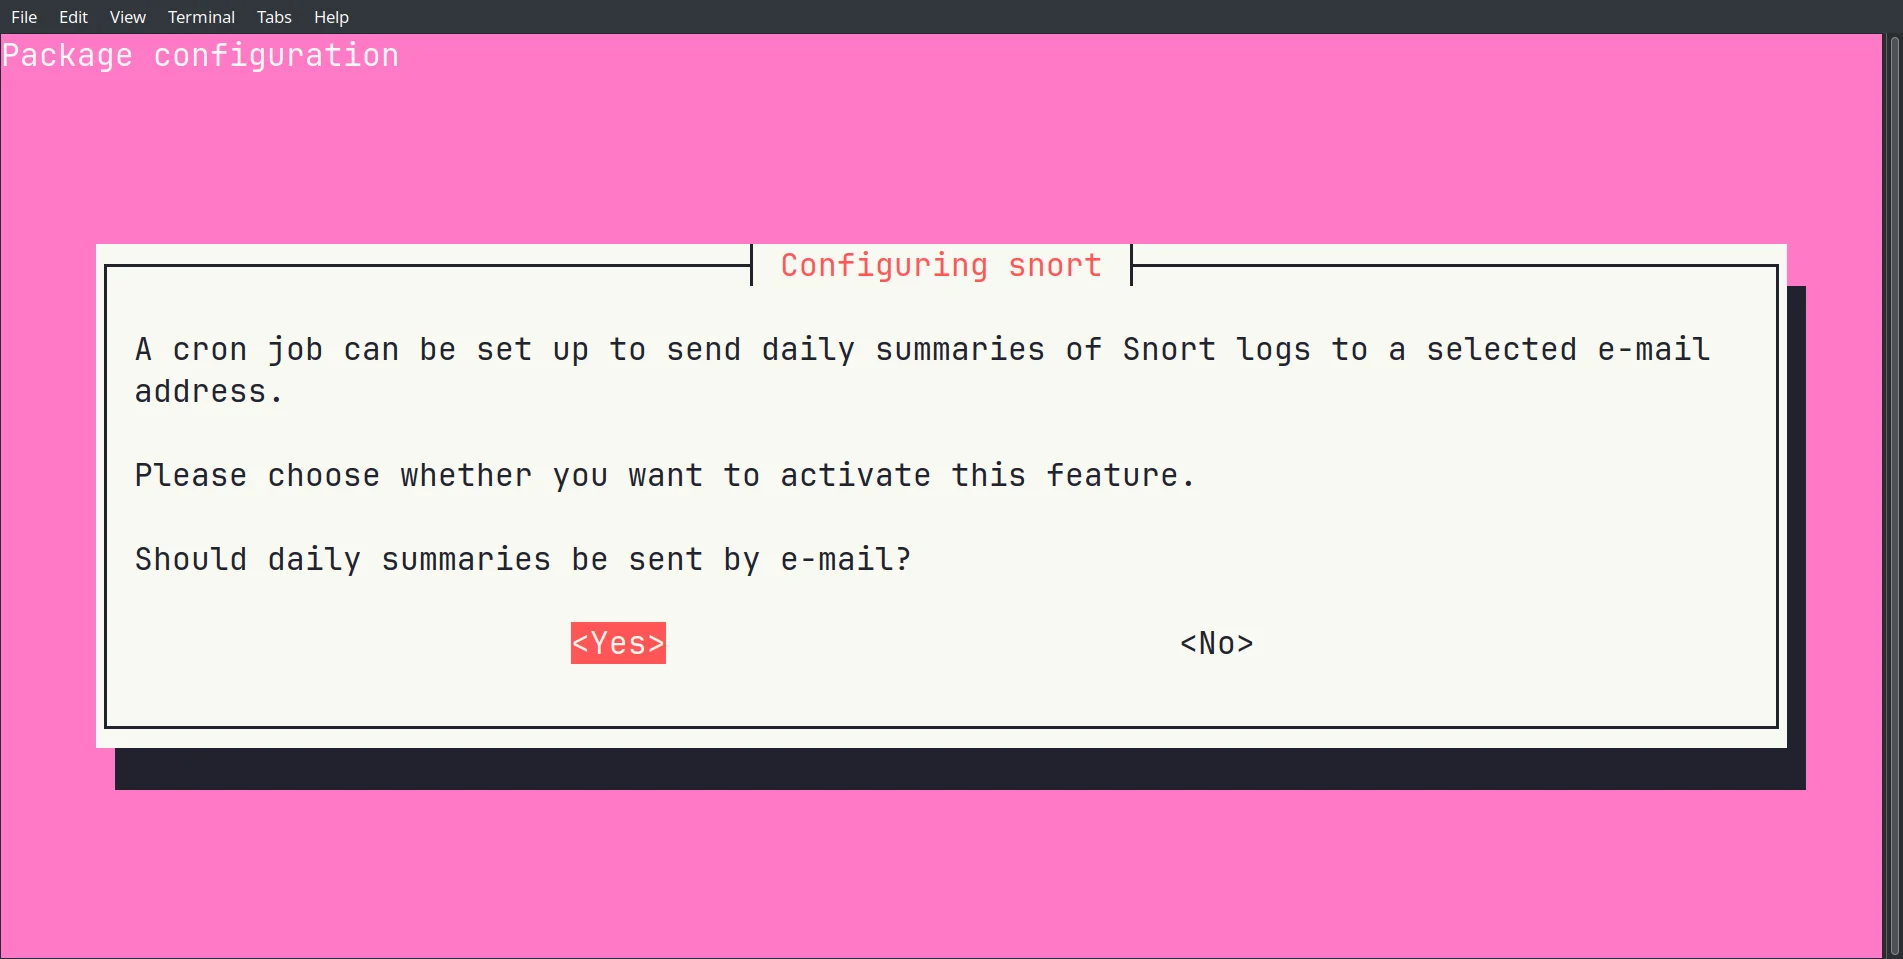
I disable email alerts. Everything goes through Elasticsearch and Kibana instead.
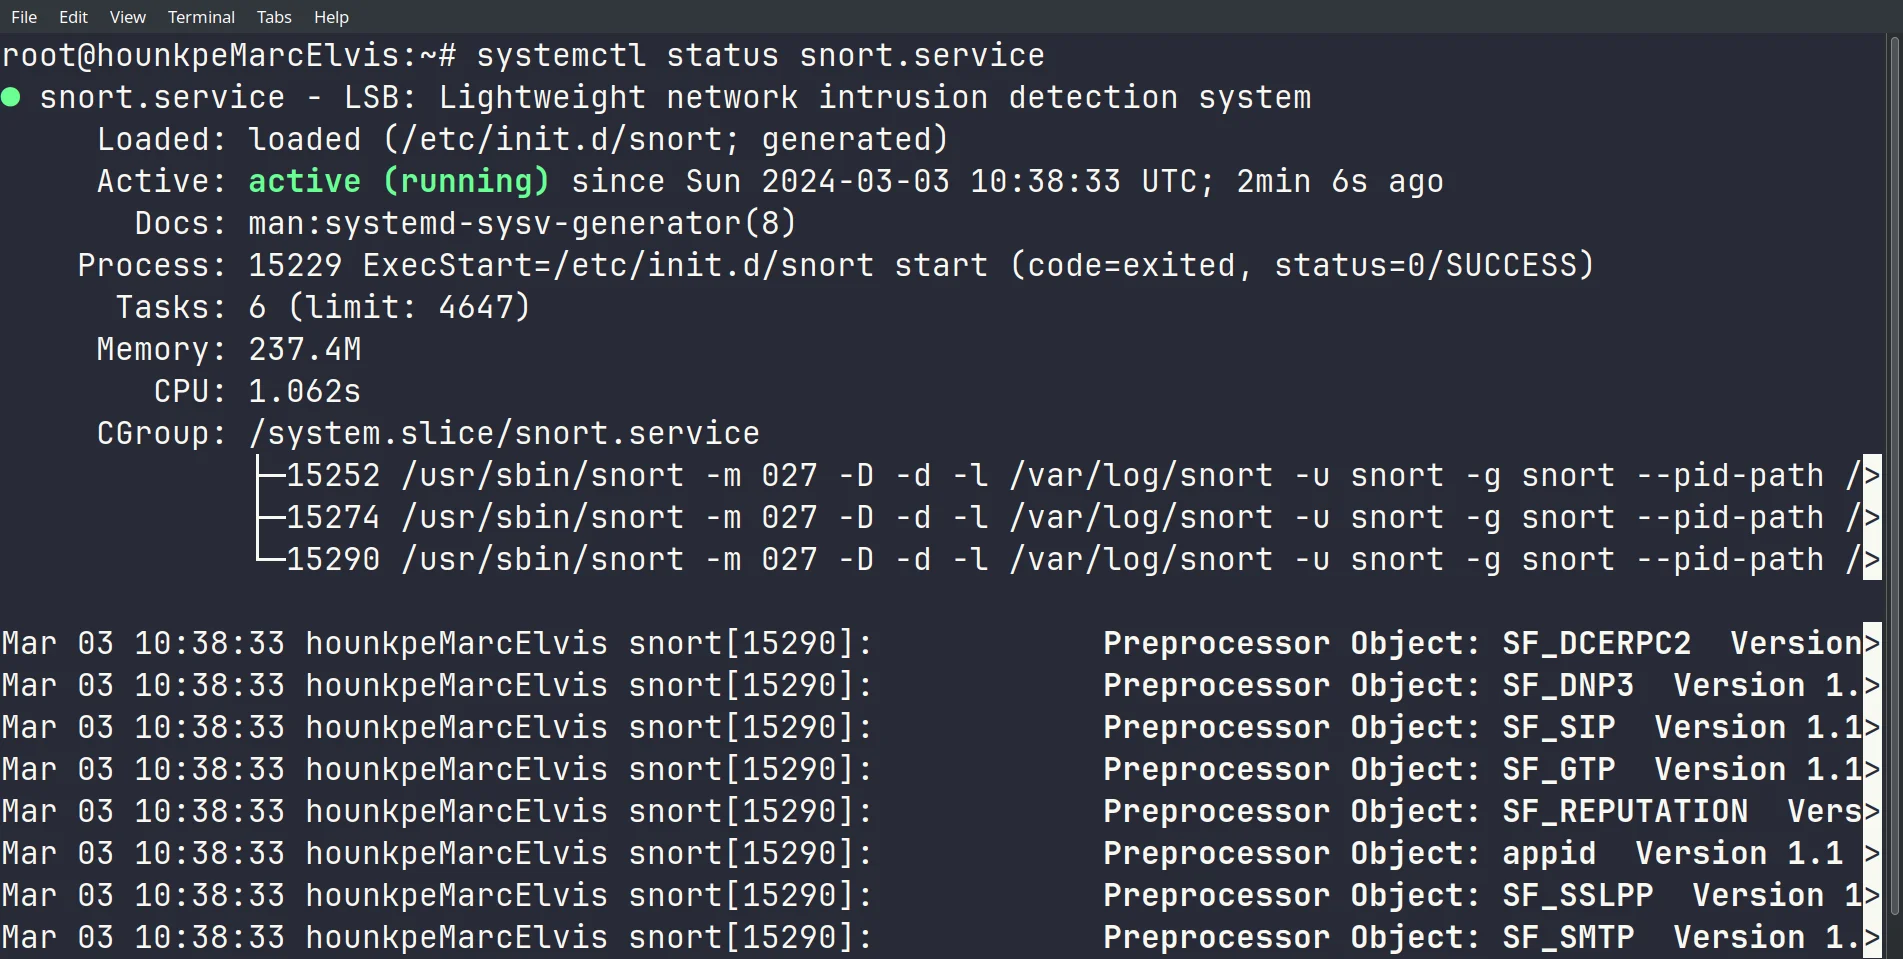
Snort is running. I check its status:
Configuring Suricata
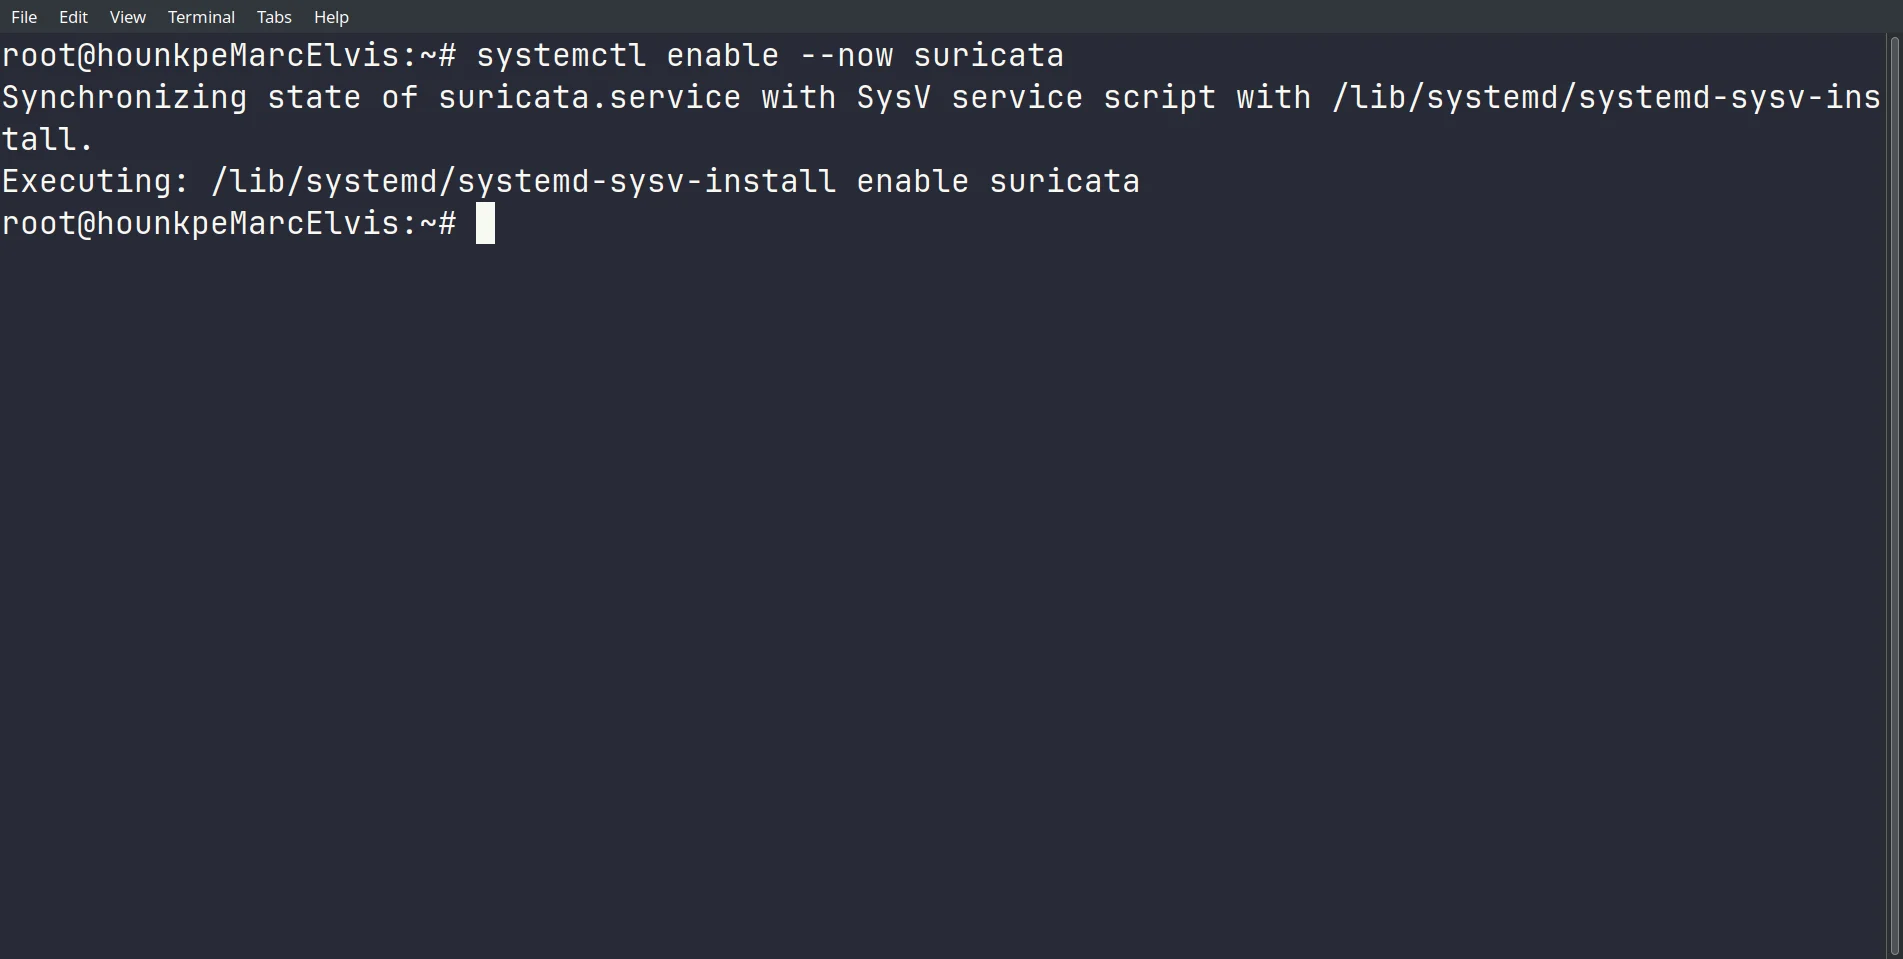
I enable Suricata at startup:
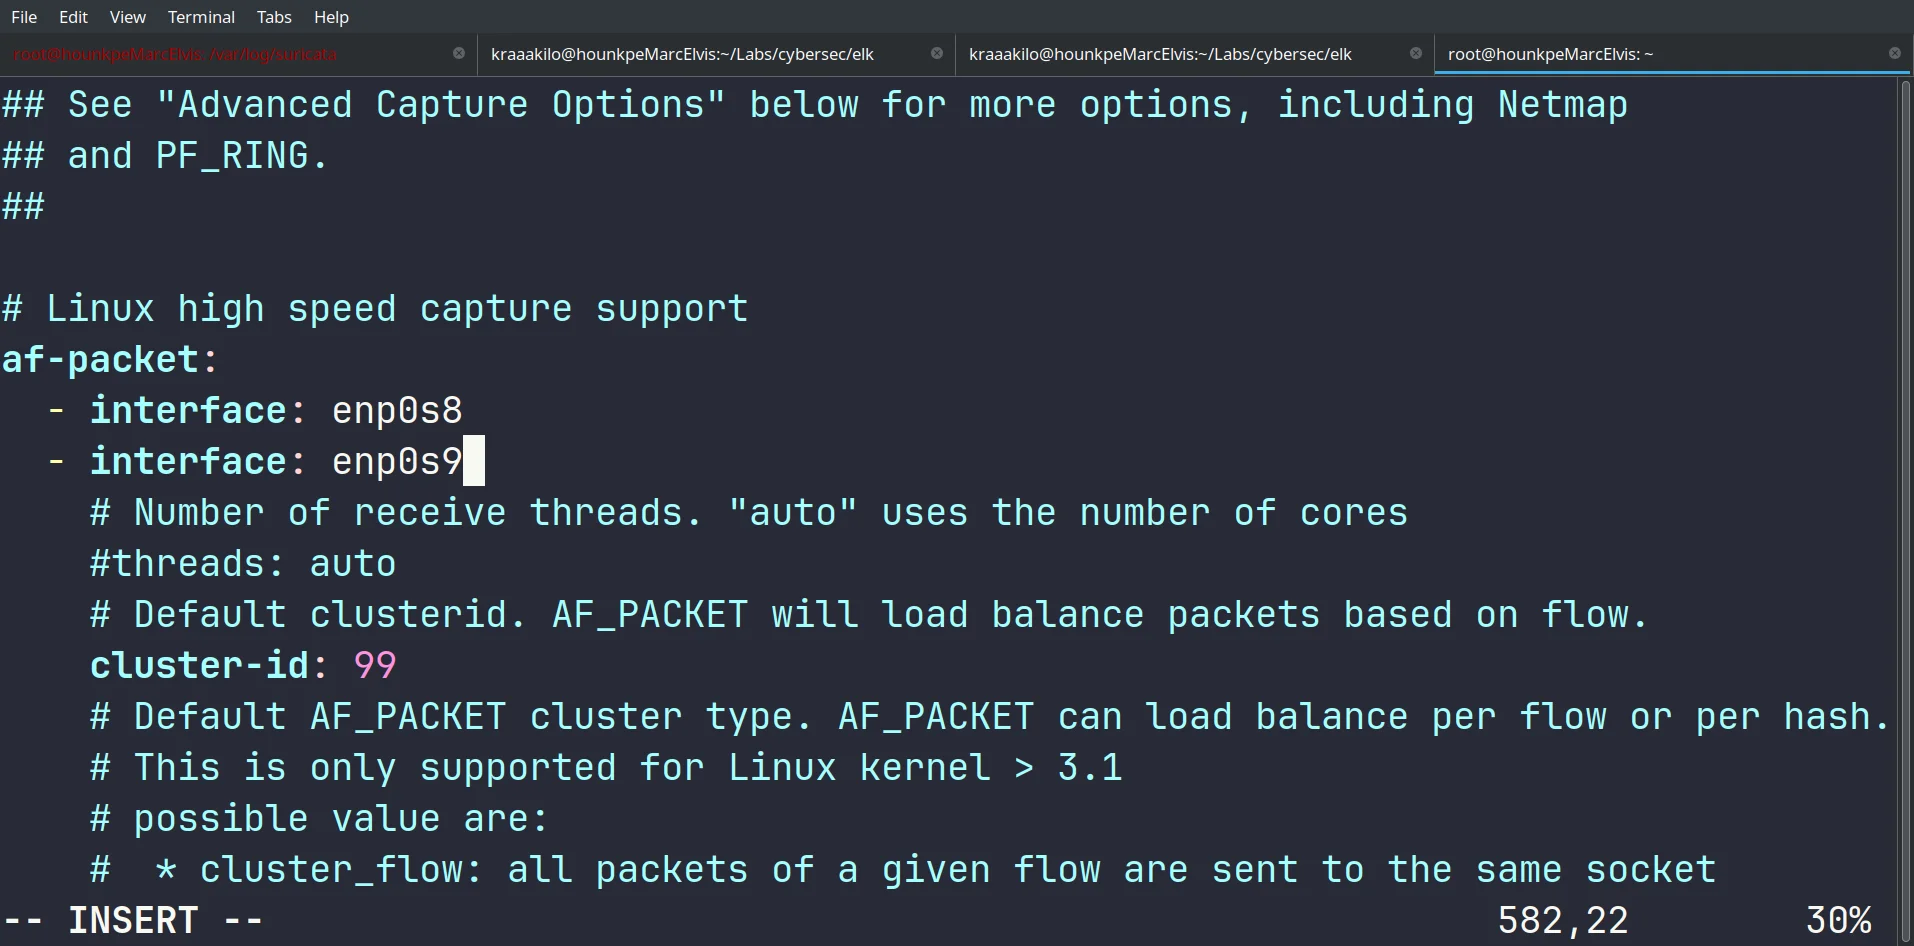
Suricata captures packets with af-packet by default. I edit the configuration to set my interfaces:
enp0s8: internal network between the VM and the hostenp0s9: main local network
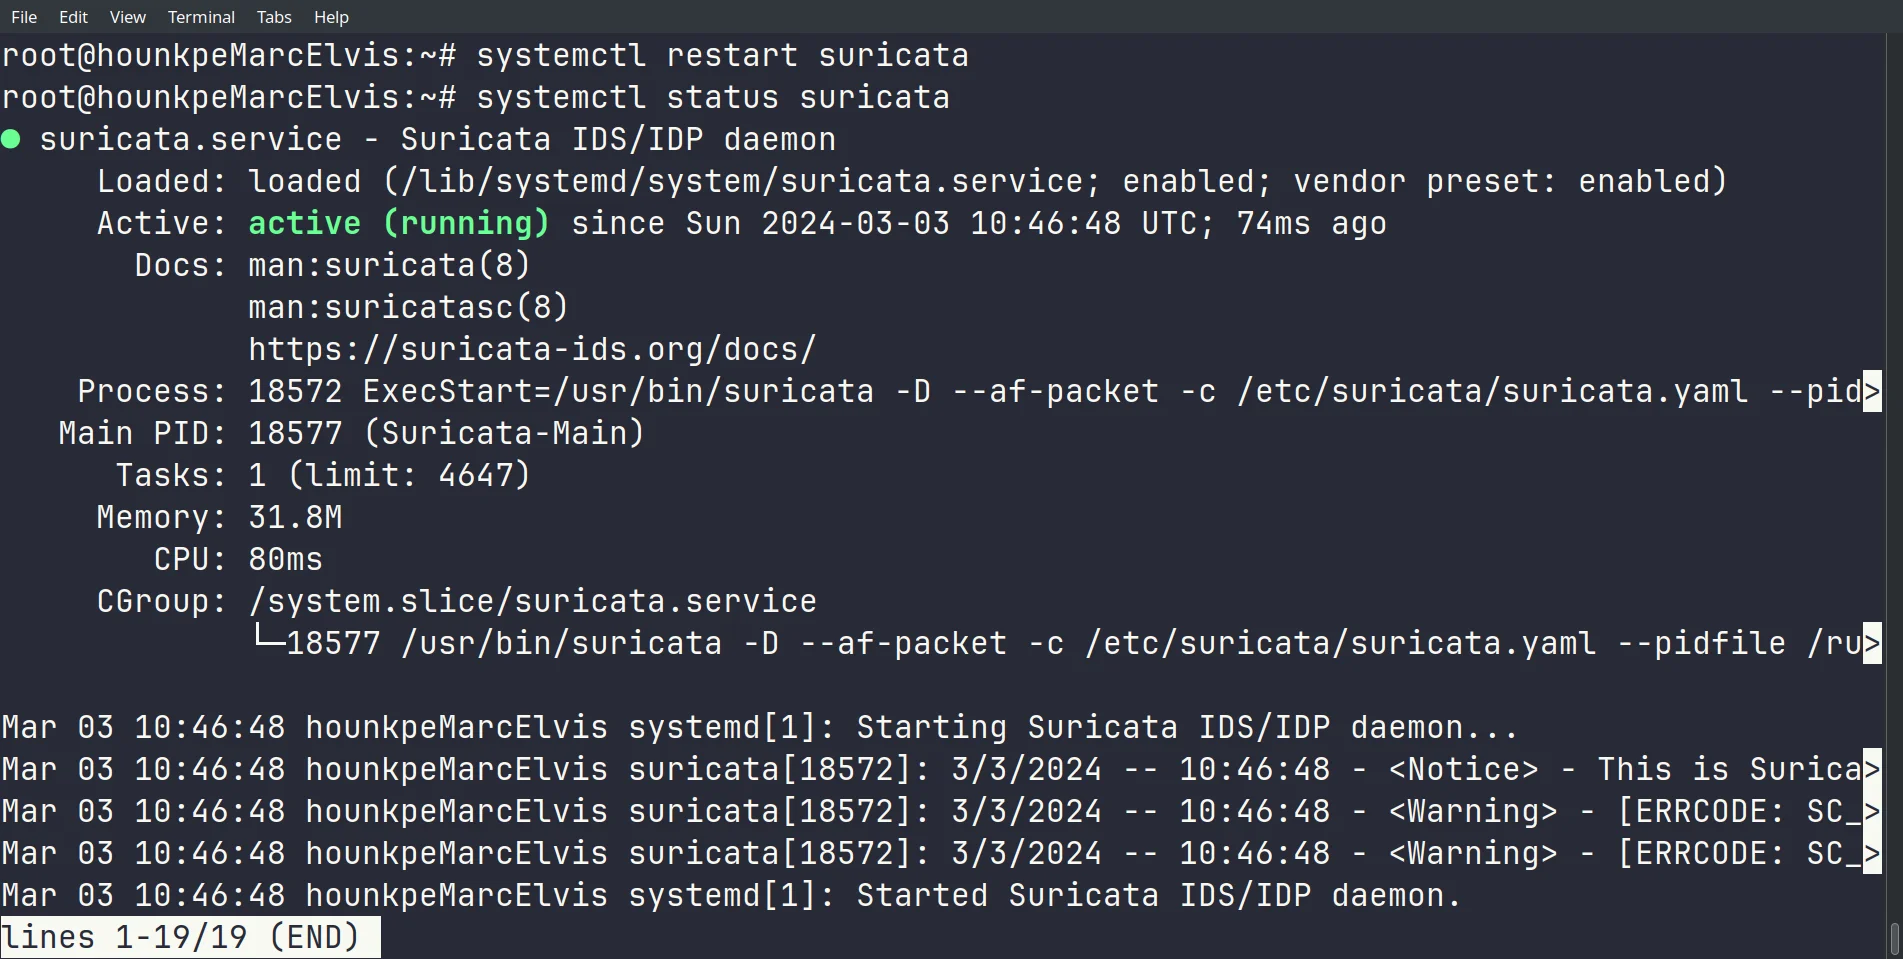
After a restart, Suricata is active:
At this point, Snort listens on all interfaces and Suricata captures traffic on
enp0s8andenp0s9.
Configuring Elasticsearch
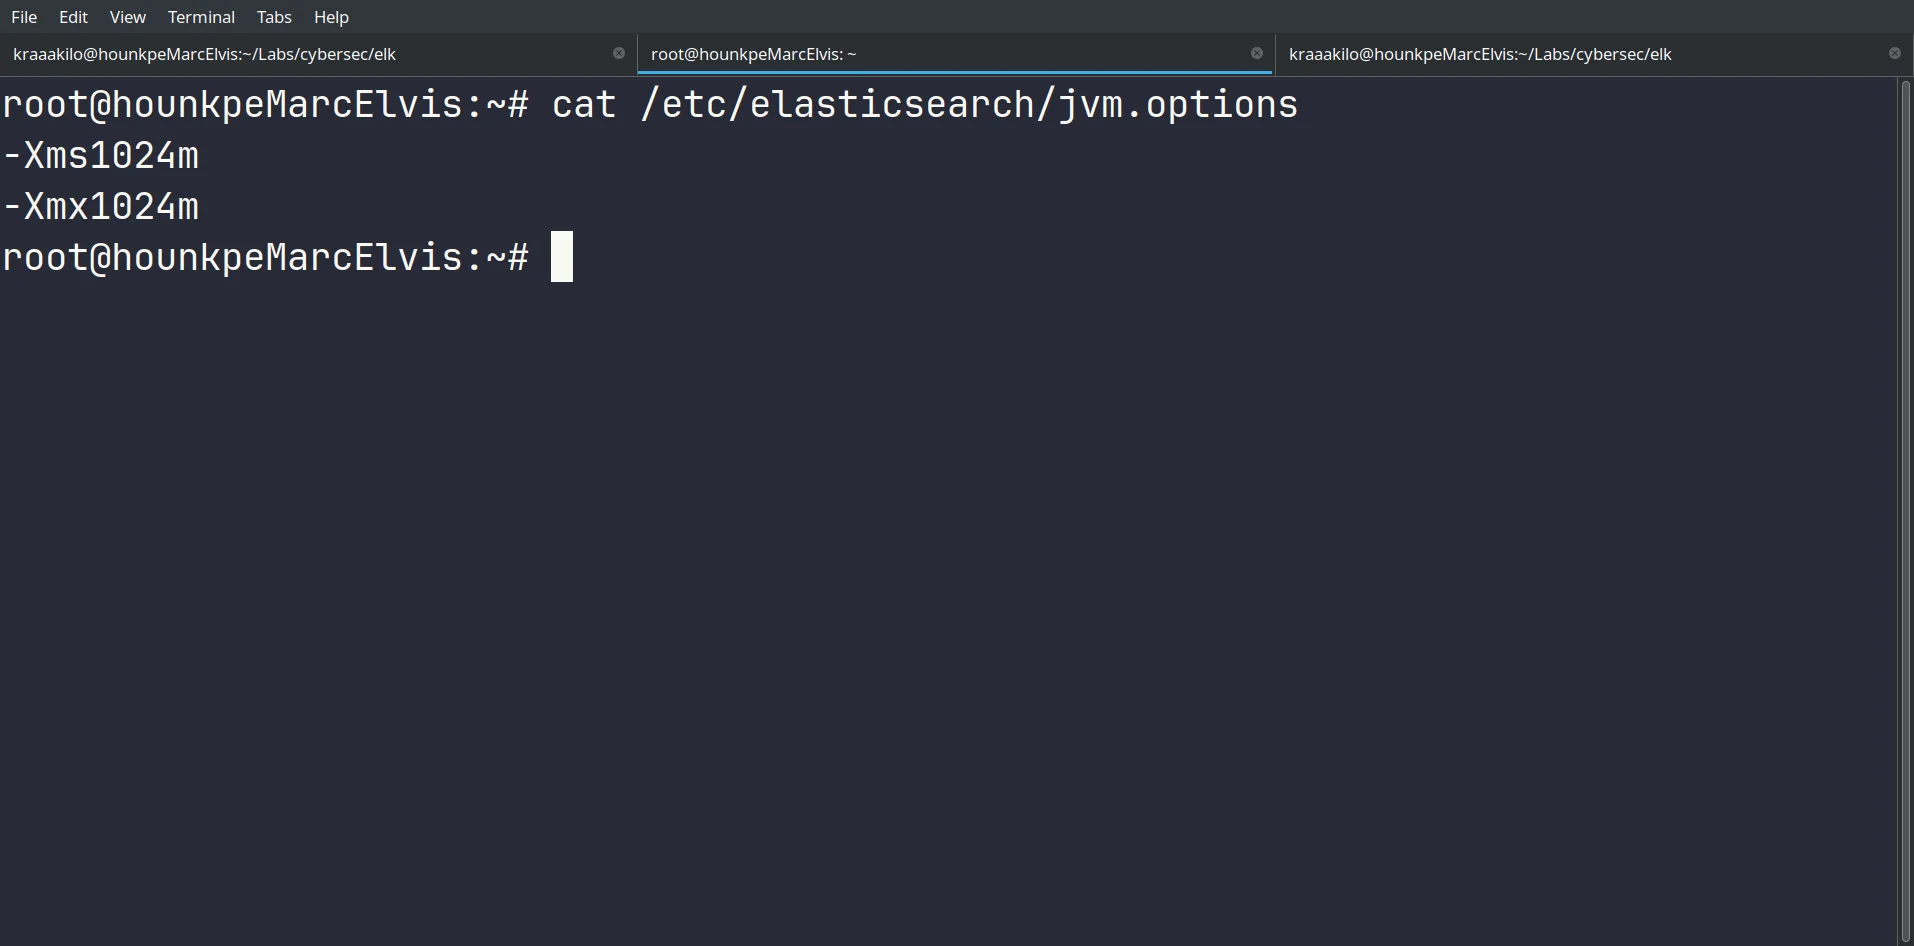
I limit Elasticsearch to 1 GB of memory, minimum and maximum. That’s enough for testing, but it can slow things down with a lot of logs.
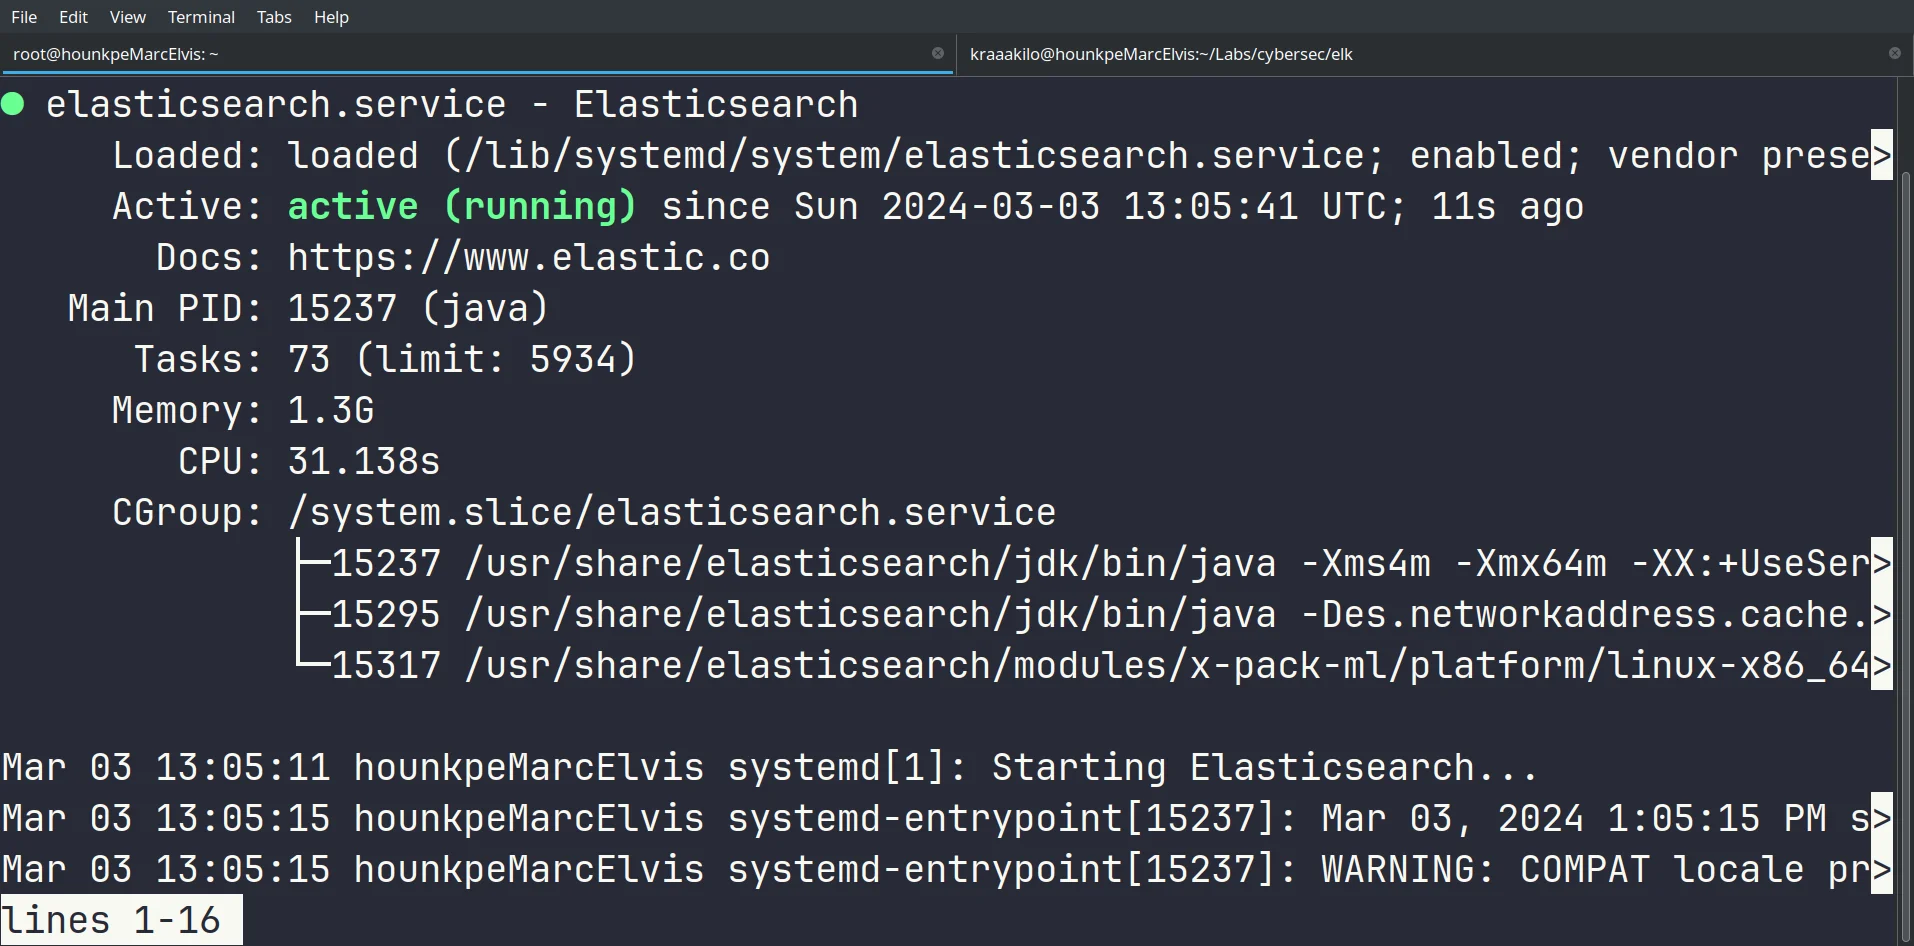
Elasticsearch is up:
Configuring Kibana
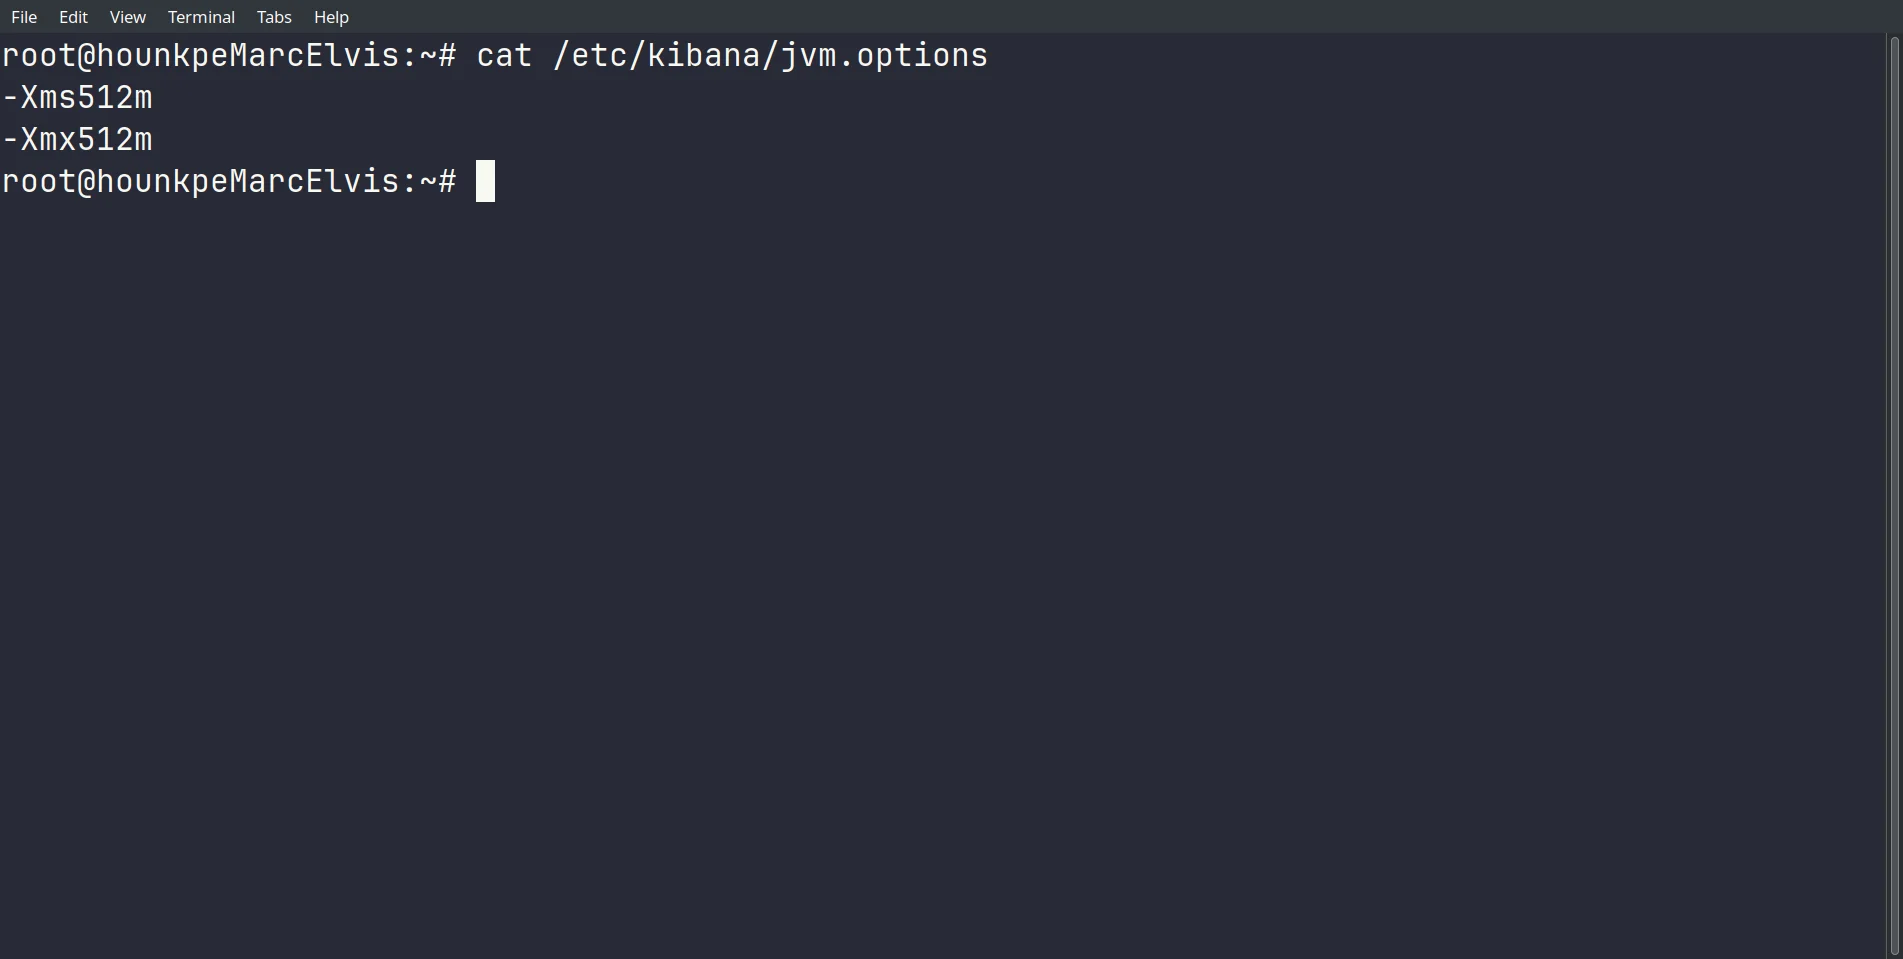
I limit Kibana to 512 MB of memory.
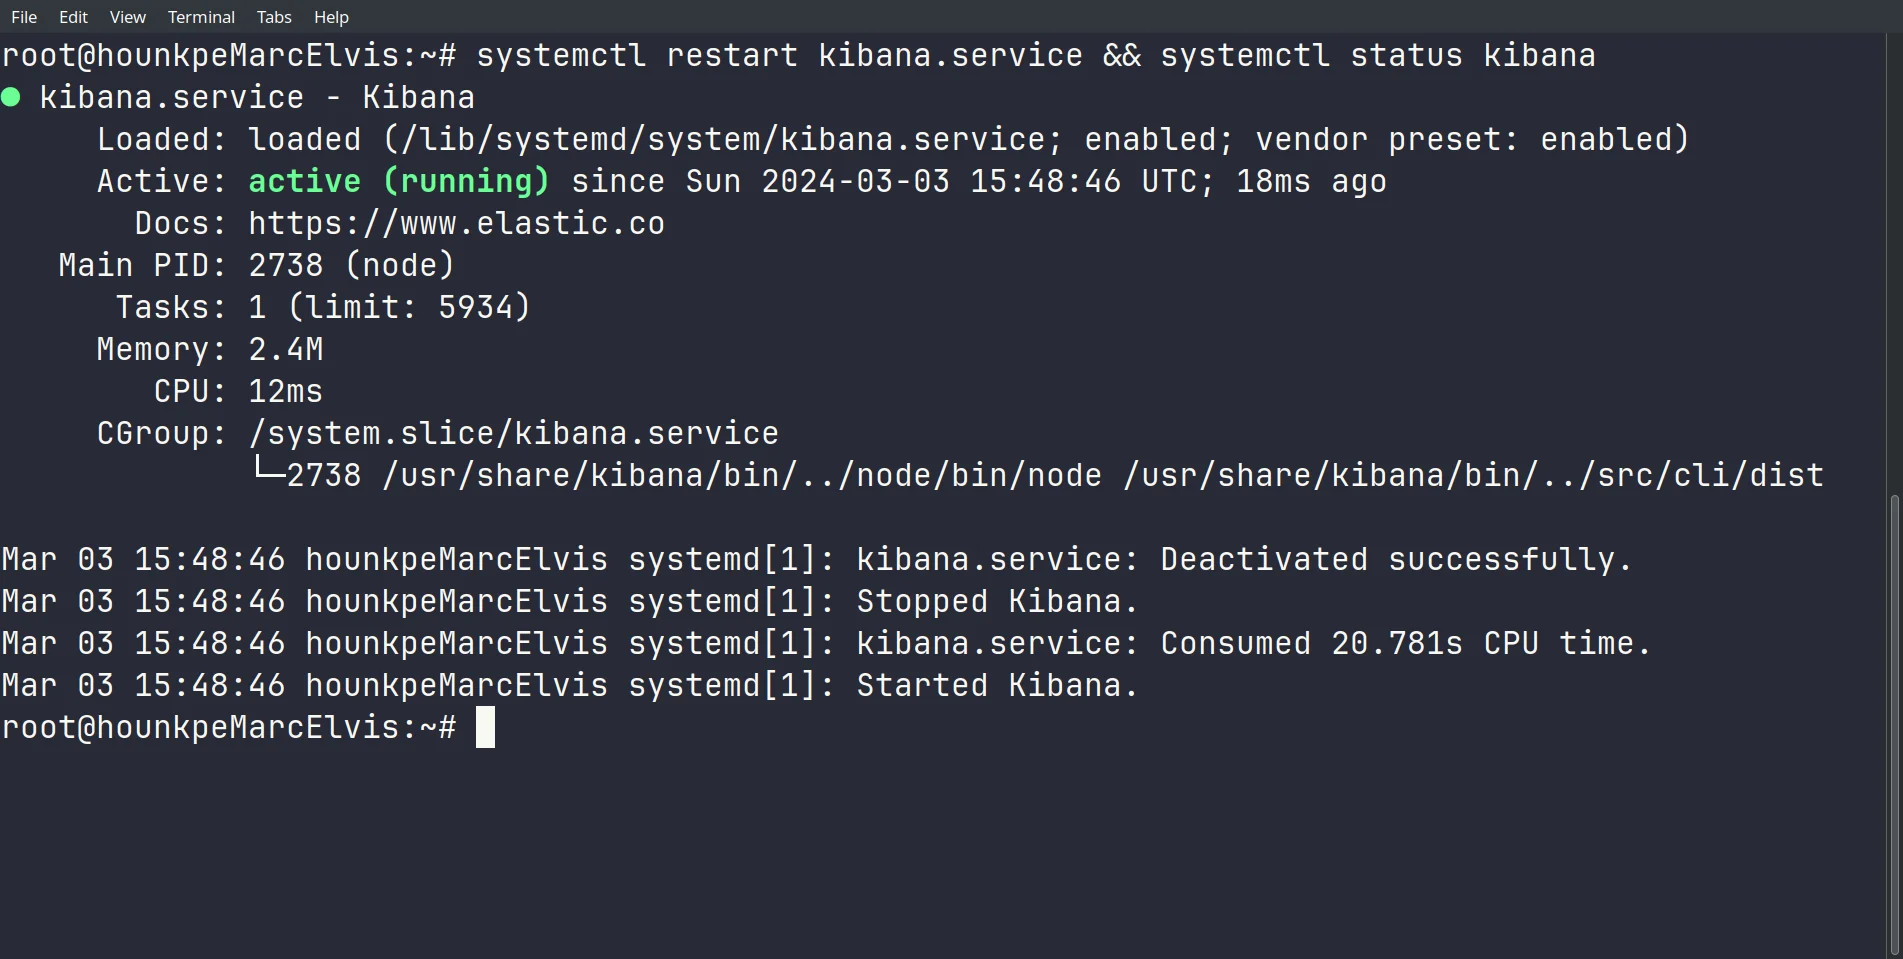
Restart and check the status:
The Vagrantfile already sets Kibana to listen on 0.0.0.0, so I can reach it from outside the VM:
sed -i 's|#server.host: "localhost"|server.host: "0.0.0.0"|g' /etc/kibana/kibana.ymlsed -i 's|#server.port: 5601|server.port: 5601|g' /etc/kibana/kibana.ymlThe web interface is at http://192.168.1.70:5601/:
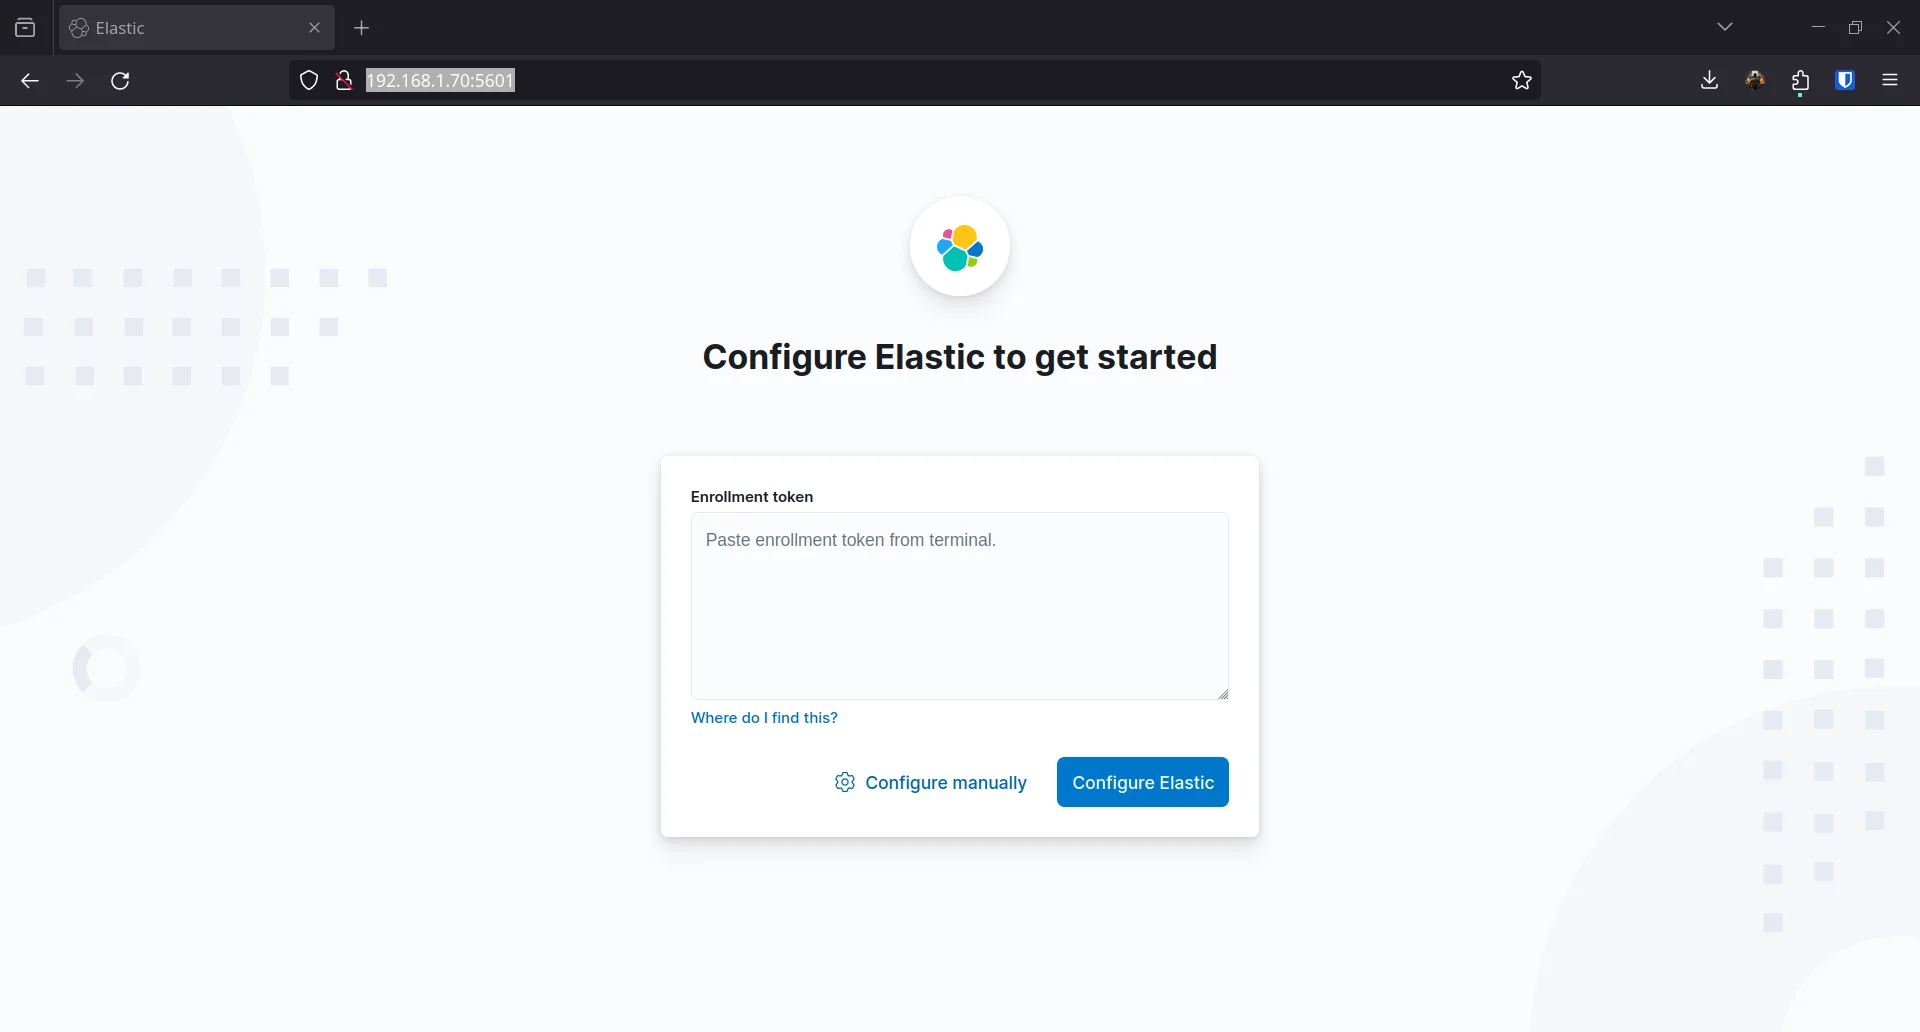
Kibana needs an enrollment token from Elasticsearch:
/usr/share/elasticsearch/bin/elasticsearch-create-enrollment-token --scope kibana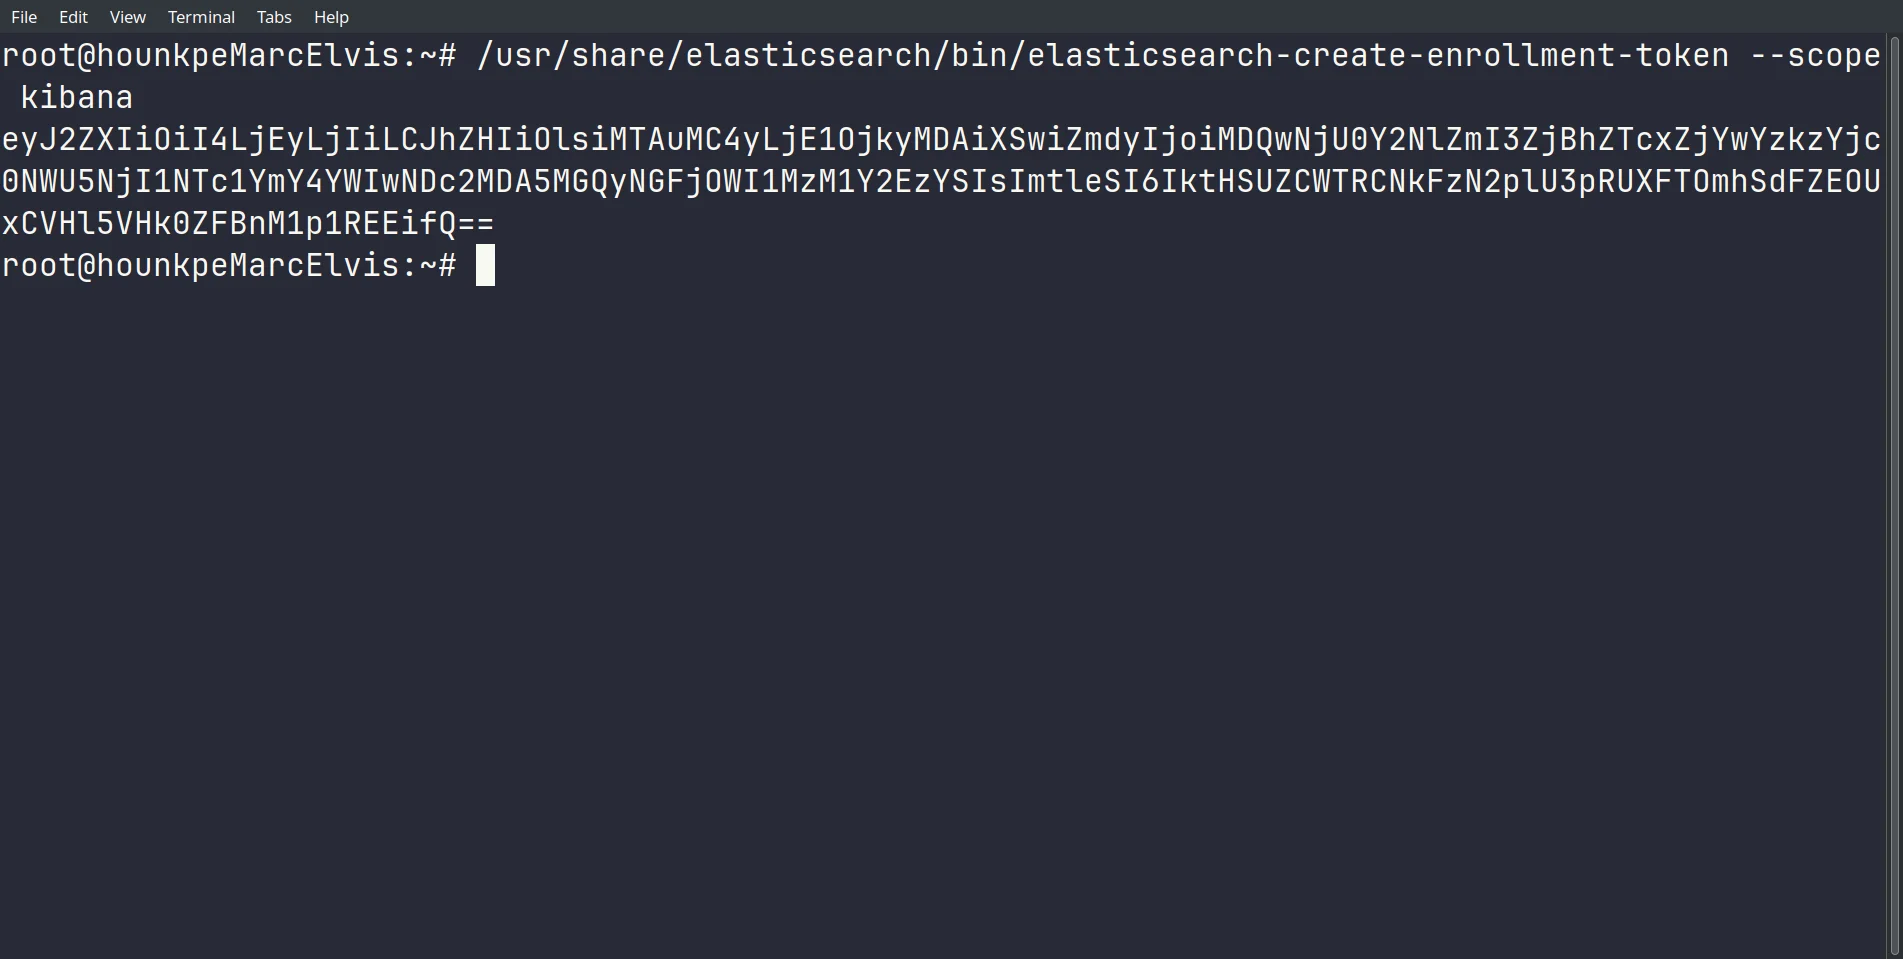
After I paste the token, Kibana asks for a verification code:
/usr/share/kibana/bin/kibana-verification-code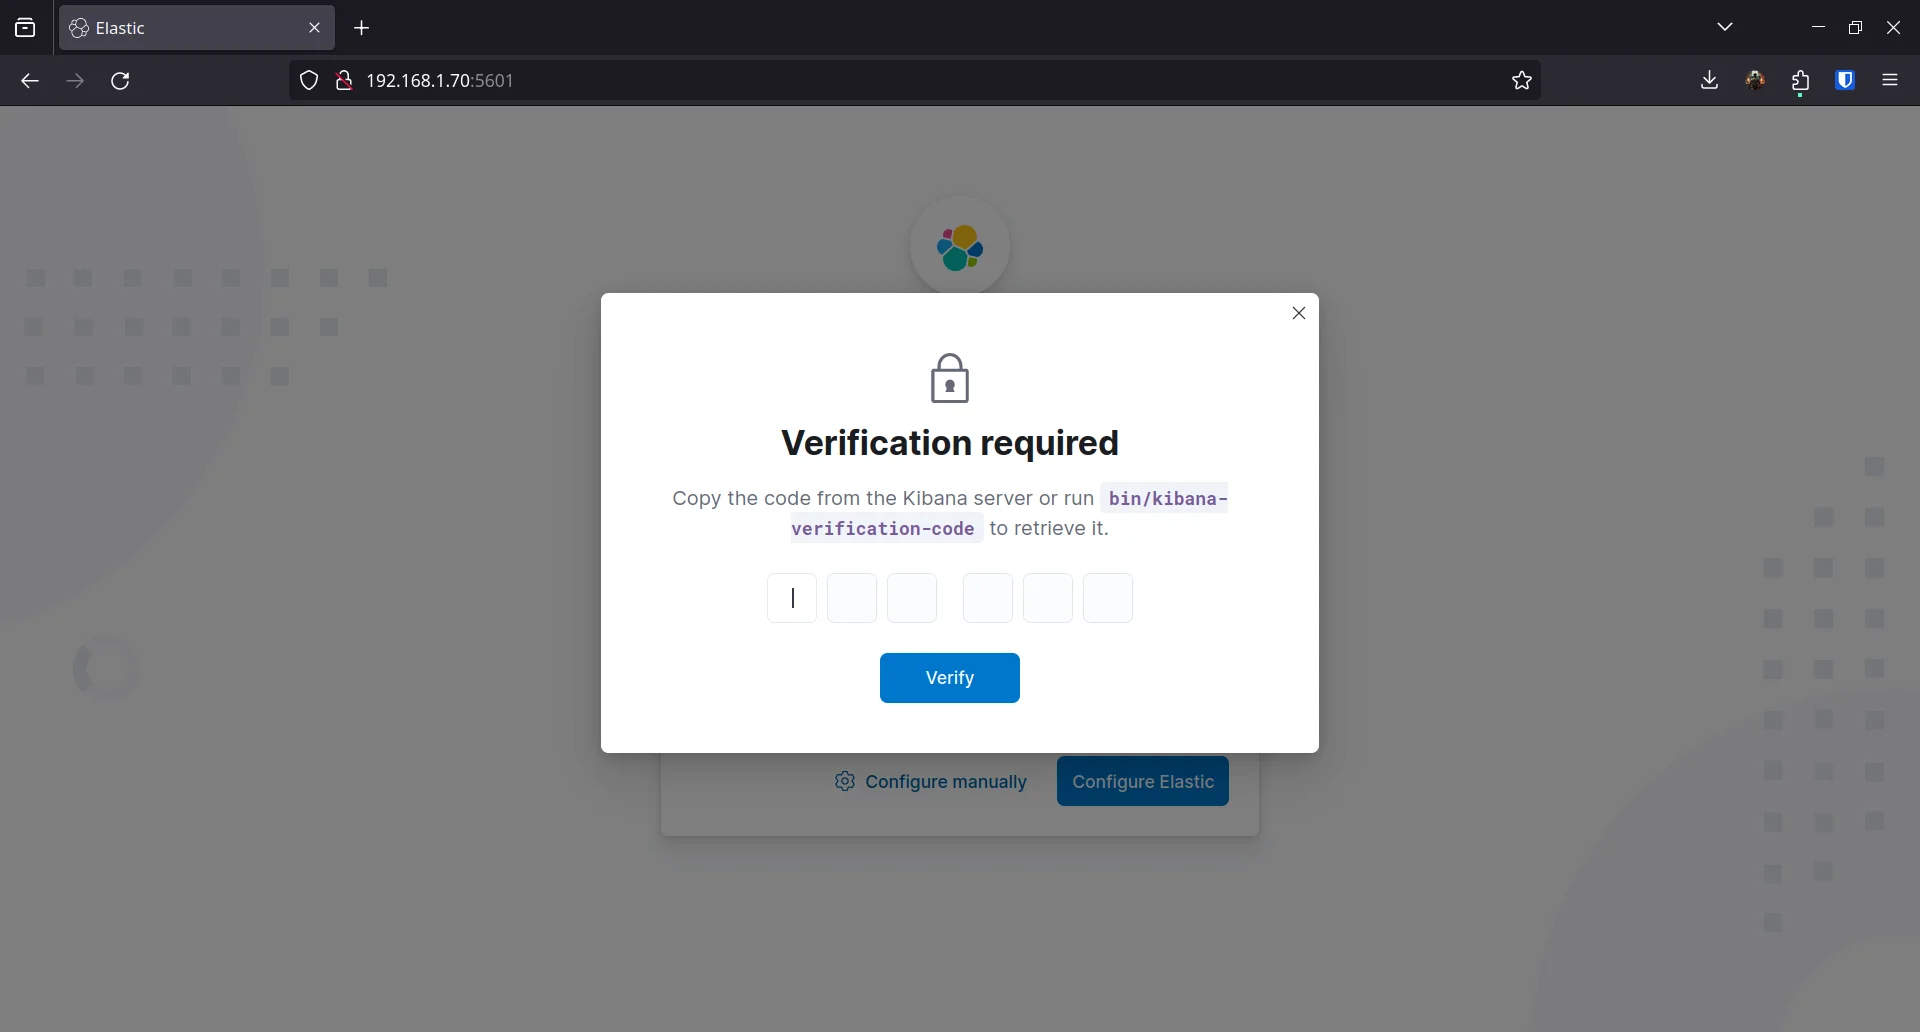
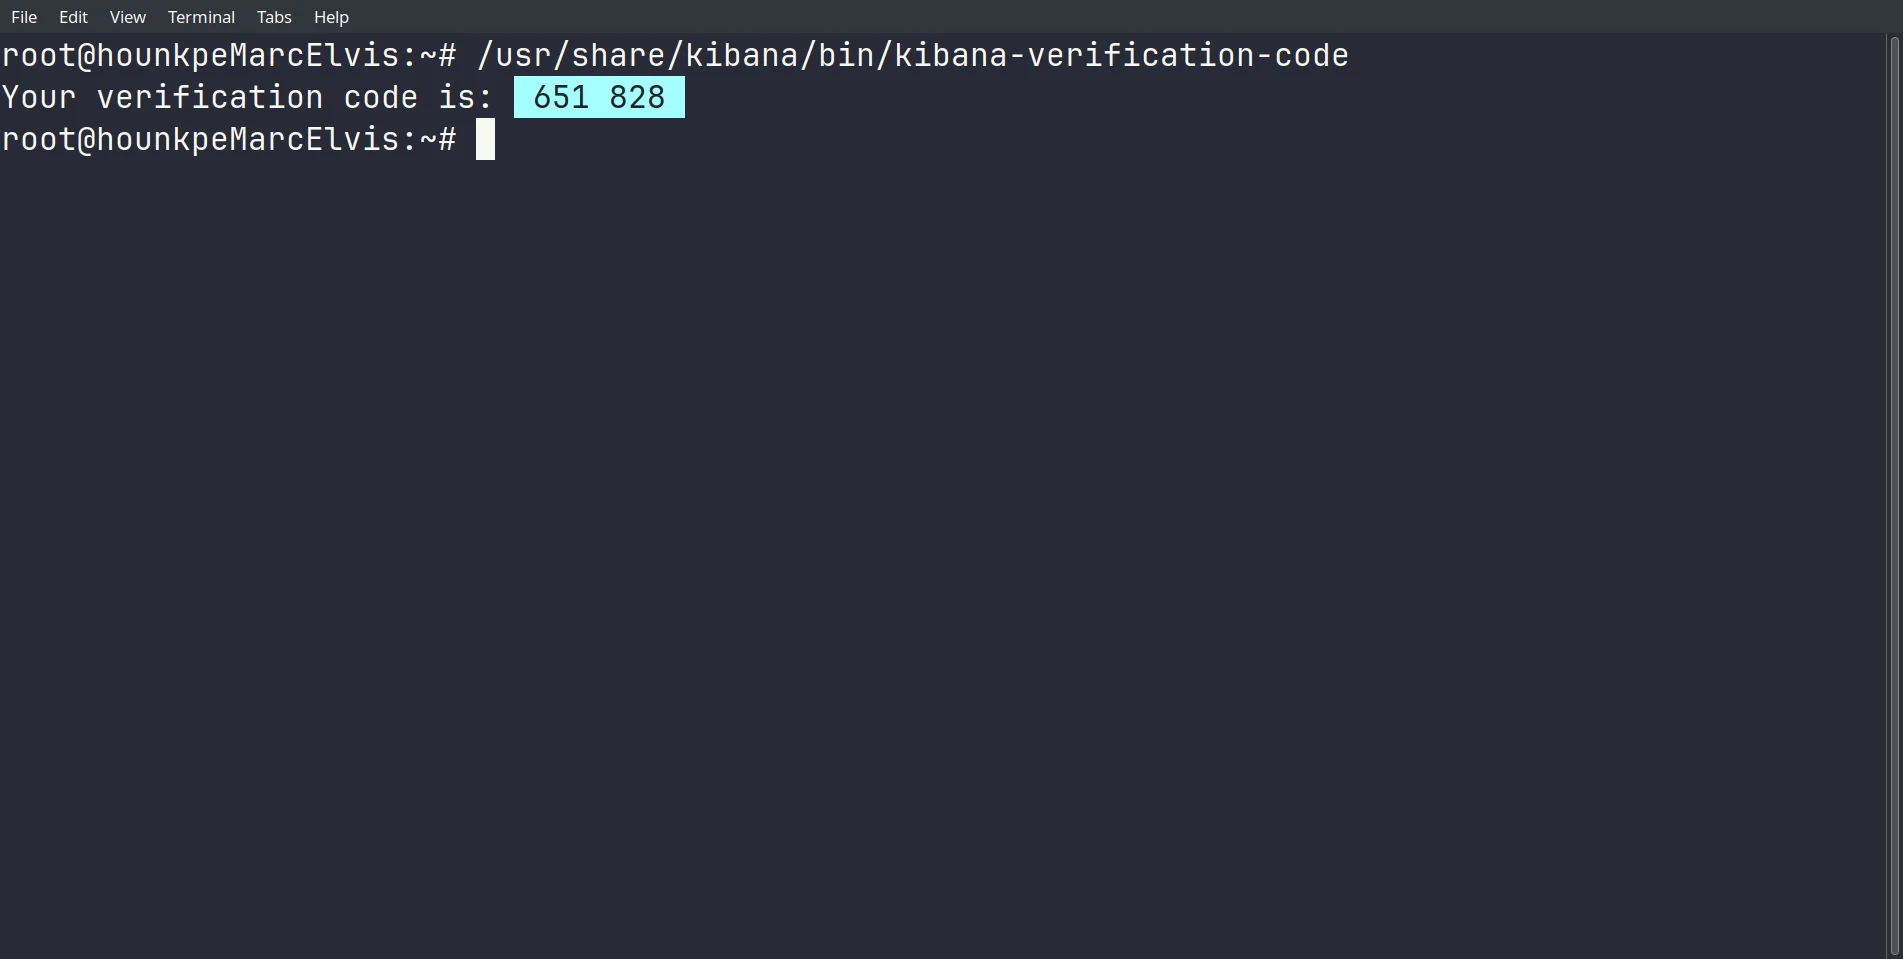
Kibana then configures itself:
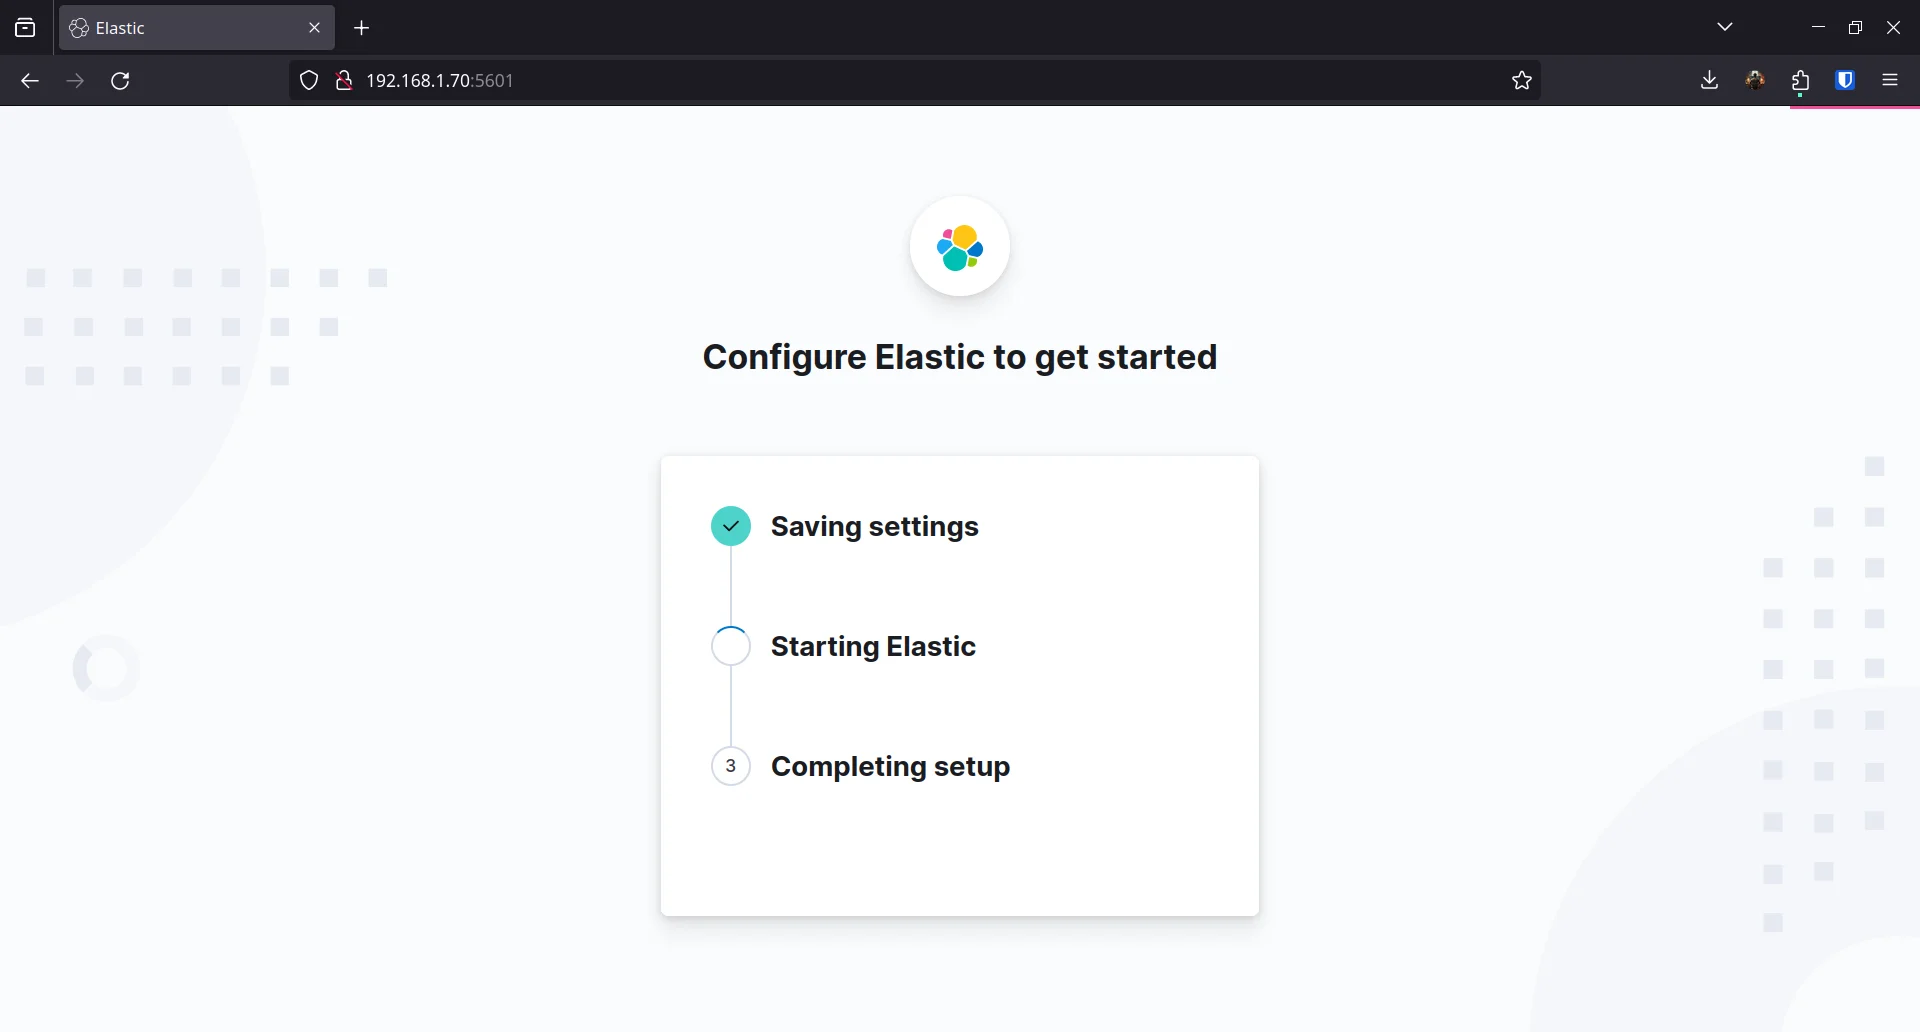
I didn’t set a password for the elastic superuser during installation, so I reset it before logging in:
/usr/share/elasticsearch/bin/elasticsearch-reset-password -u elastic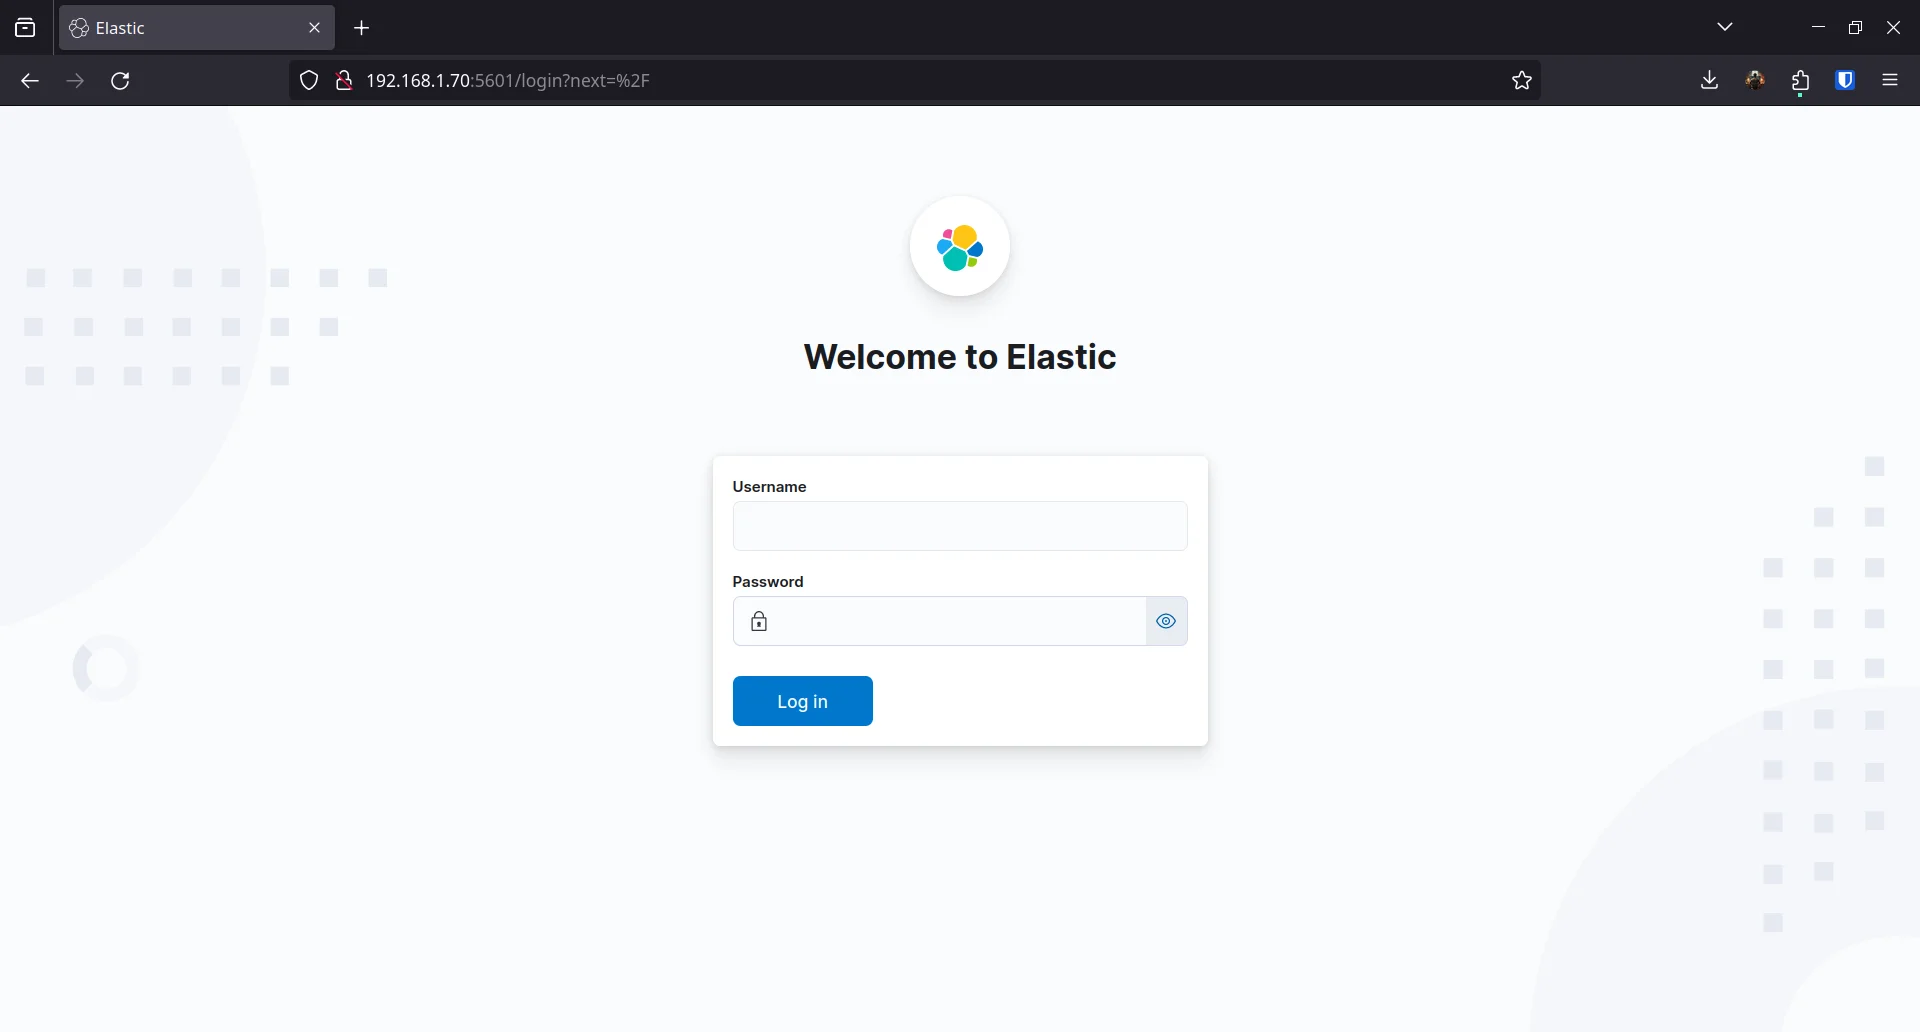
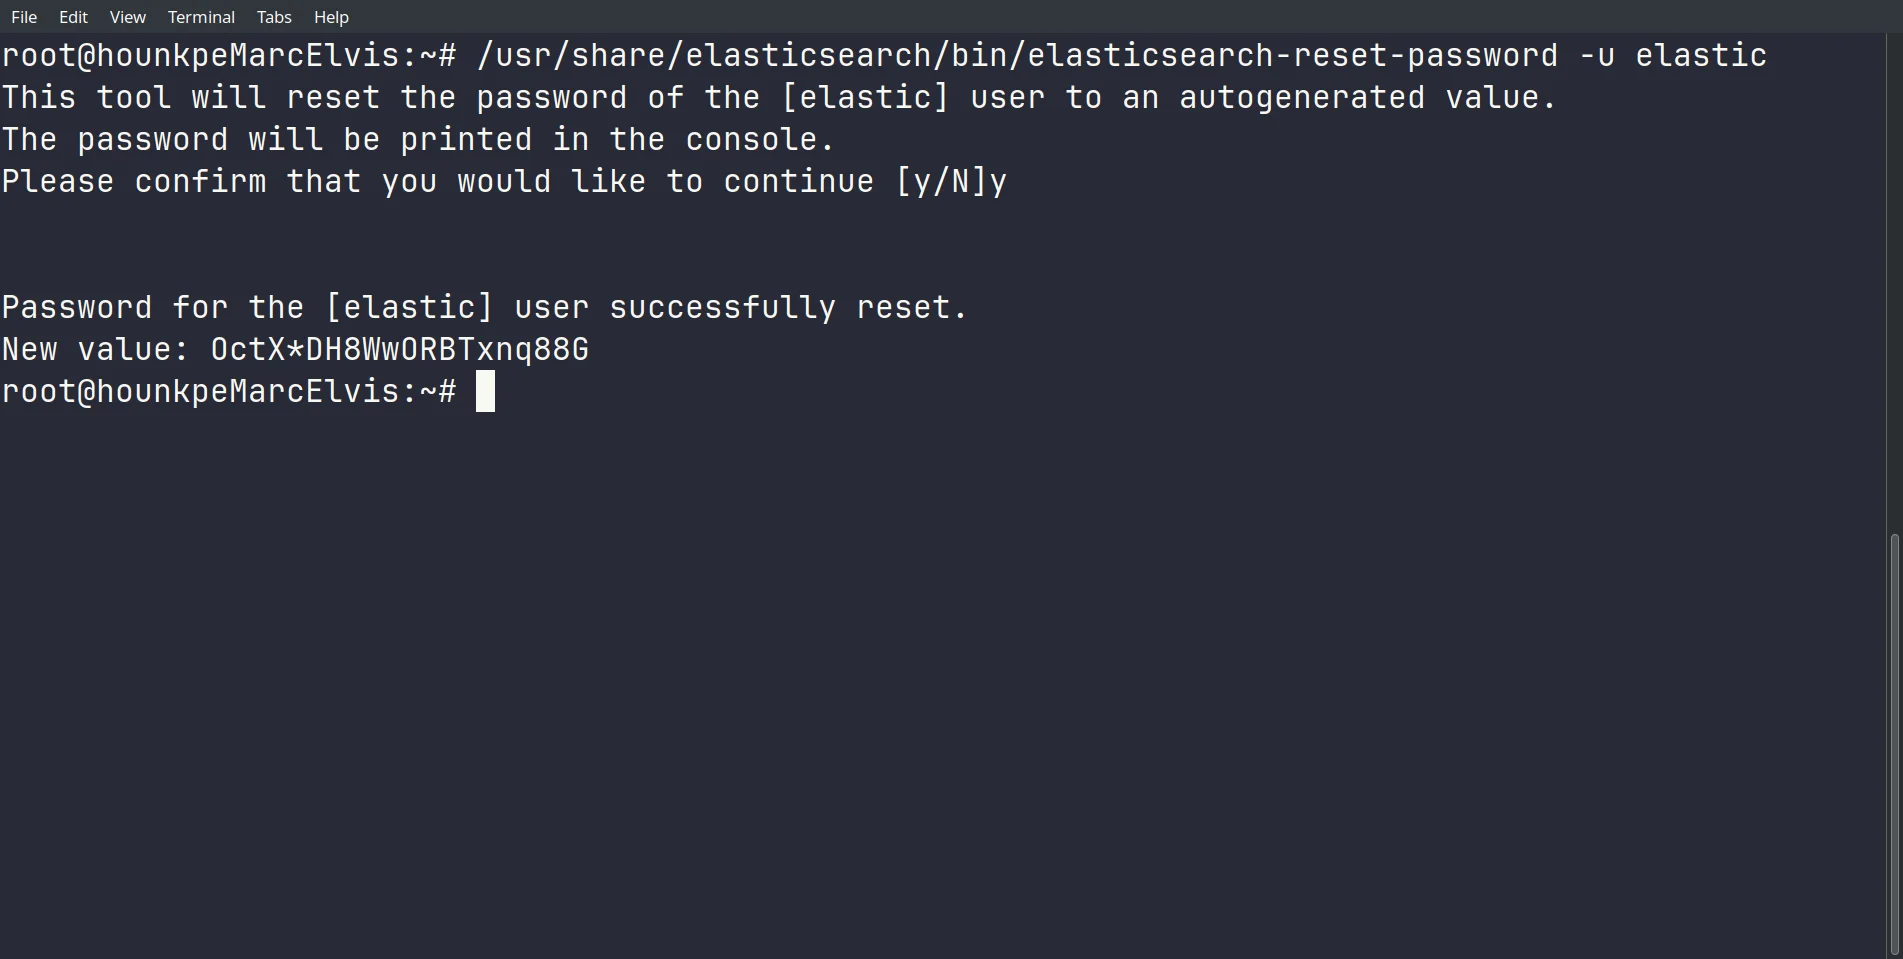
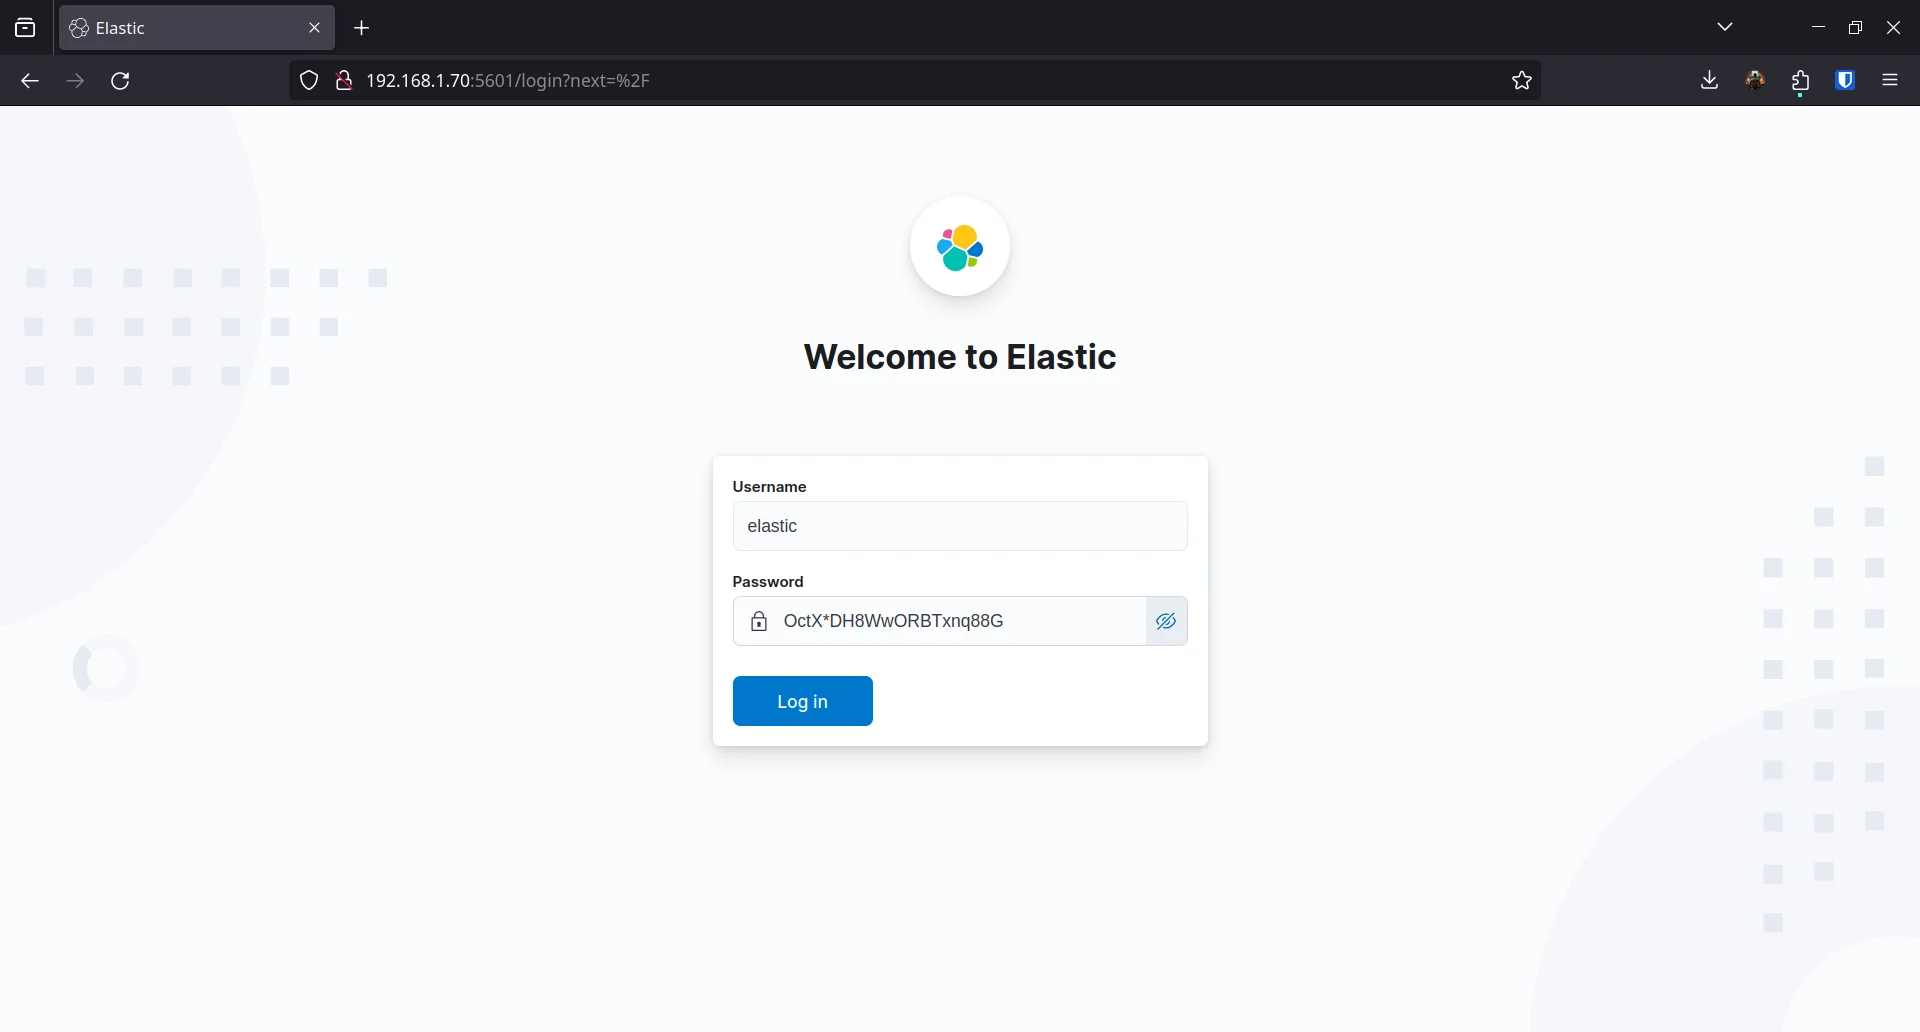
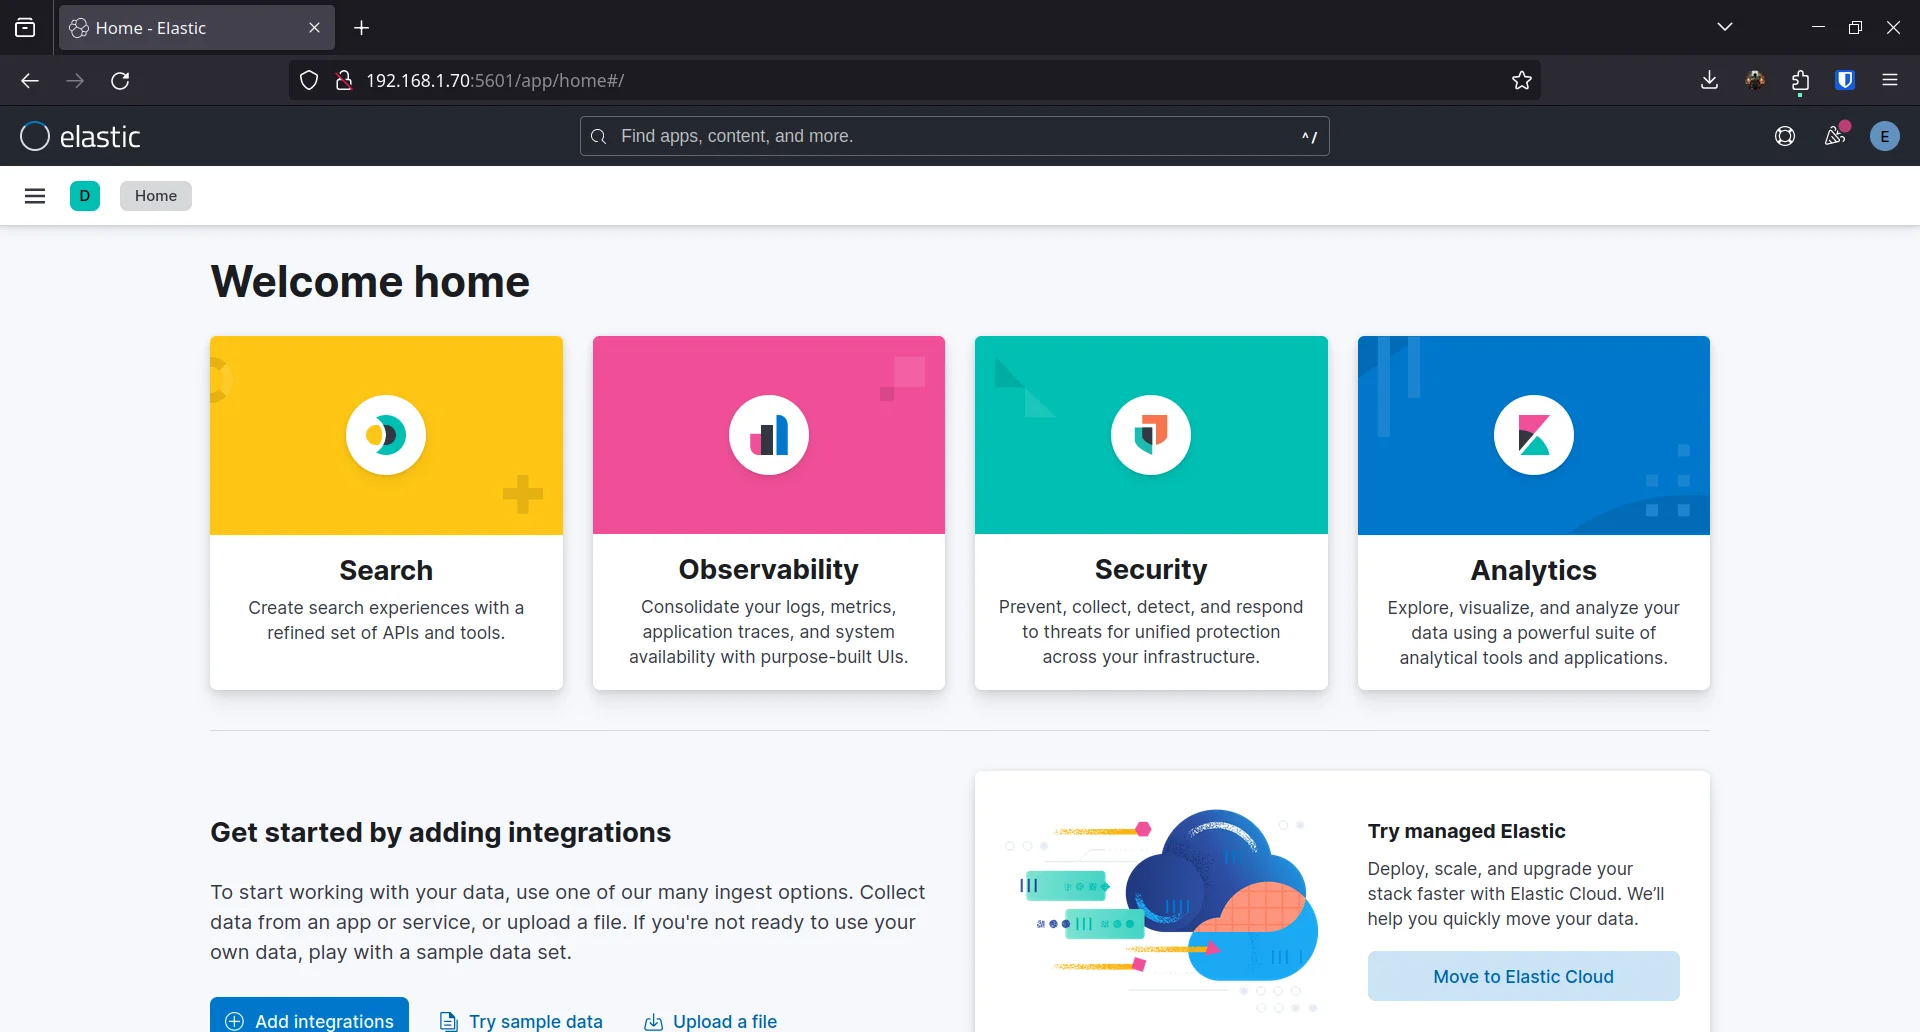
Then I log in with those credentials:
Logstash Pipelines
A Logstash pipeline has a source (input), transformations (filter), and a destination (output). I write one for Snort and one for Suricata.
Snort Pipeline
input {    file {        path => "/var/log/snort/snort.alert.fast"        start_position => "beginning"        sincedb_path => "/dev/null"    }}
filter {    grok {        match => { "message" => "%{MONTHNUM}/%{MONTHDAY}-%{TIME} %{DATA} \[%{DATA}\] \[%{DATA:signature}\] \[%{DATA}\] \[Priority: %{INT:priority}\] \{%{WORD:protocol}\} %{IP:source_address}:%{NUMBER:source_port} -> %{IP:destination_address}:%{NUMBER:destination_port}" }    }
    date {        match => [ "timestamp", "dd/MMM/yyyy:HH:mm:ss Z" ]        target => "@timestamp"    }}
output {    elasticsearch {        index => "logstash-%{+YYYY.MM.dd}"        hosts => ["https://localhost:9200"]        user => "elastic"        password => "maybe_secure_password_here ?!"        ssl => true        cacert => "/etc/elasticsearch/certs/http_ca.crt"        ssl_certificate_verification => true        manage_template => false    }    stdout { codec => rubydebug }}
grok parses each Snort alert into fields: signature, priority, protocol, and source and destination addresses and ports. date converts the timestamp into a format Elasticsearch understands.
Suricata Pipeline
input {  file {    path => ["/var/log/suricata/eve.json"]    sincedb_path => "/var/lib/logstash/sincedb_suricata"    codec => json    type => "SuricataIDPS"  }}
filter {  if [type] == "SuricataIDPS" {    date {      match => [ "timestamp", "ISO8601" ]    }    ruby {      code => "if event['event_type'] == 'fileinfo'; event['fileinfo']['type']=event['fileinfo']['magic'].to_s.split(',')[0]; end;"    }  }
  if [src_ip]  {    geoip {      source => "src_ip"      target => "geoip"      add_field => [ "[geoip][coordinates]", "%{[geoip][longitude]}" ]      add_field => [ "[geoip][coordinates]", "%{[geoip][latitude]}"  ]    }    mutate {      convert => [ "[geoip][coordinates]", "float" ]    }    if ![geoip.ip] {      if [dest_ip]  {        geoip {          source => "dest_ip"          target => "geoip"          add_field => [ "[geoip][coordinates]", "%{[geoip][longitude]}" ]          add_field => [ "[geoip][coordinates]", "%{[geoip][latitude]}"  ]        }        mutate {          convert => [ "[geoip][coordinates]", "float" ]        }      }    }  }}
output {  elasticsearch {    index => "logstash-%{+YYYY.MM.dd}"    hosts => ["https://localhost:9200"]    user => "elastic"    password => "maybe_secure_password_here ?!"    ssl => true    cacert => "/etc/elasticsearch/certs/http_ca.crt"    ssl_certificate_verification => true    manage_template => false  }  stdout { codec => rubydebug }}
Suricata writes JSON to eve.json, so codec => json parses it directly. geoip adds coordinates for the source and destination IPs. The ruby block pulls the file type out of the magic field on fileinfo events.
Testing
Before sending anything to Elasticsearch, I remove the output elasticsearch block and test with console output only.
Snort Test
/usr/share/logstash/bin/logstash --path.settings /etc/logstash/ -f /etc/logstash/conf.d/snort-pipeline.conf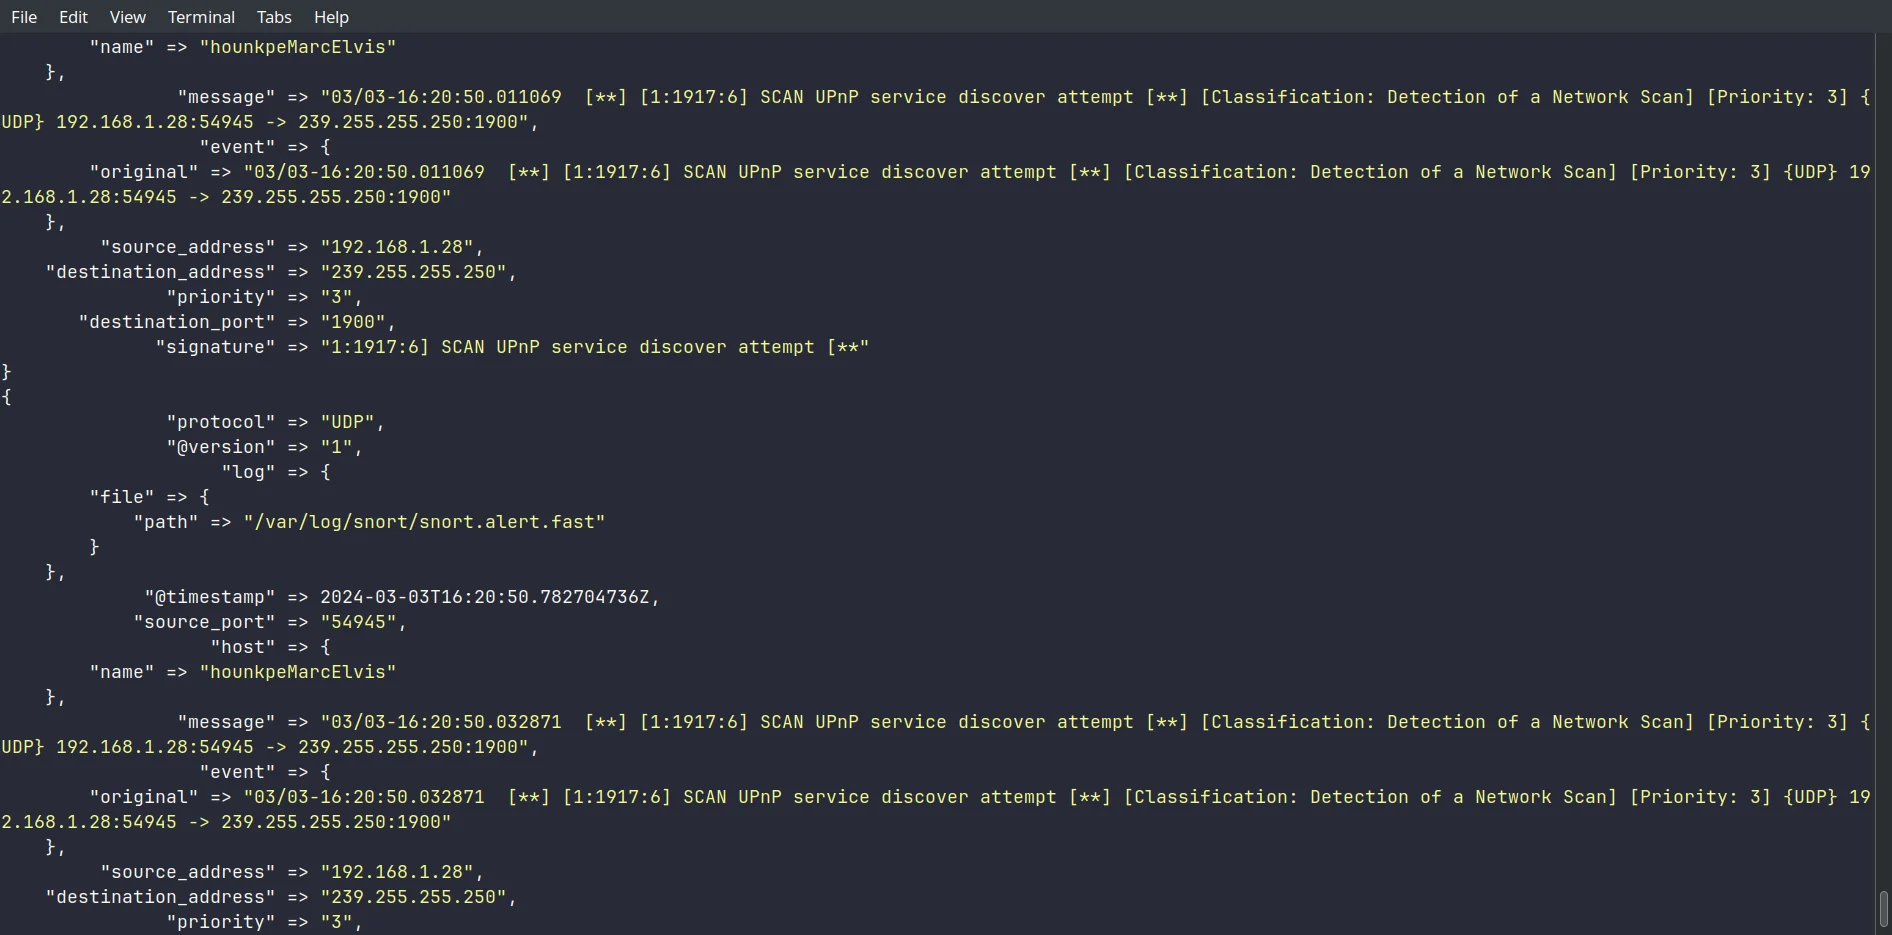
The fields come out as expected.
Suricata Test
/usr/share/logstash/bin/logstash --path.settings /etc/logstash/ -f /etc/logstash/conf.d/suricata-pipeline.conf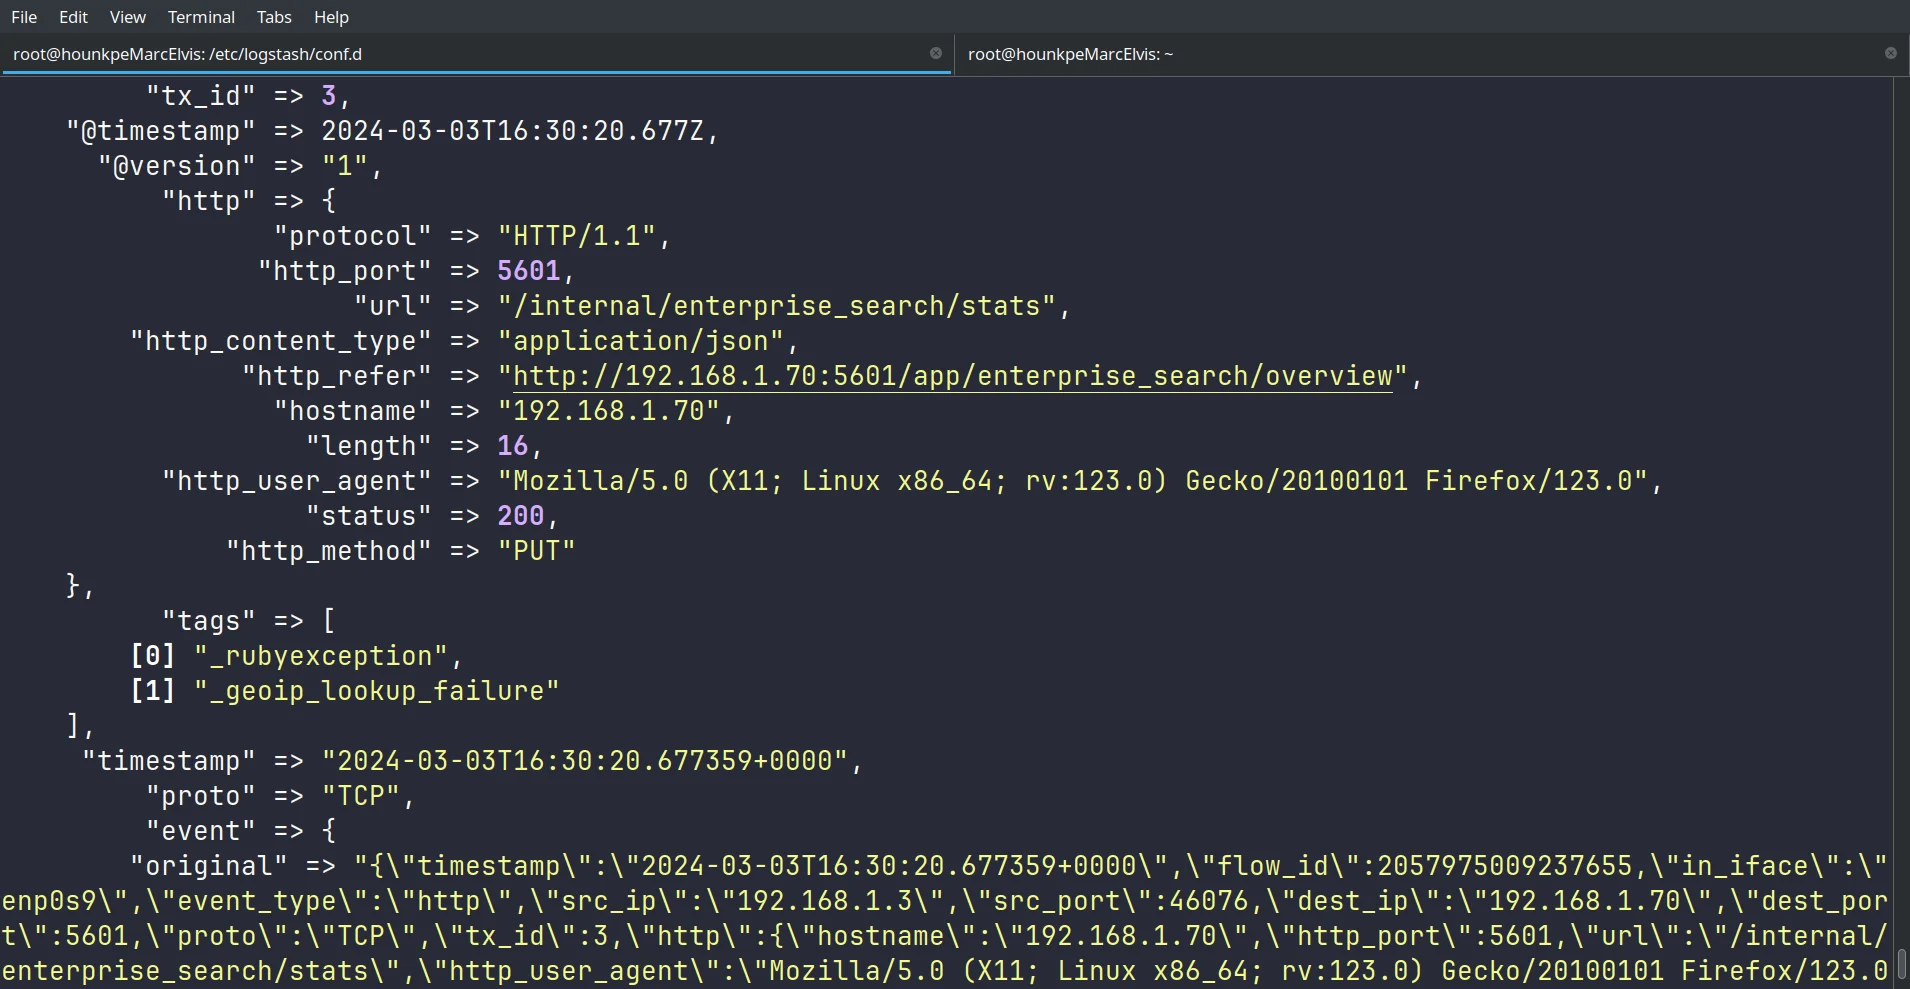
Suricata logs parse correctly too.
Indexing in Elasticsearch
With the tests passing, I put the output elasticsearch block back and rename the indexes so they’re easy to find in Kibana:
# Snortoutput {    elasticsearch {        index => "snort-%{+YYYY.MM.dd}"        ...    }}
# Suricataoutput {    elasticsearch {        index => "suricata-%{+YYYY.MM.dd}"        ...    }}
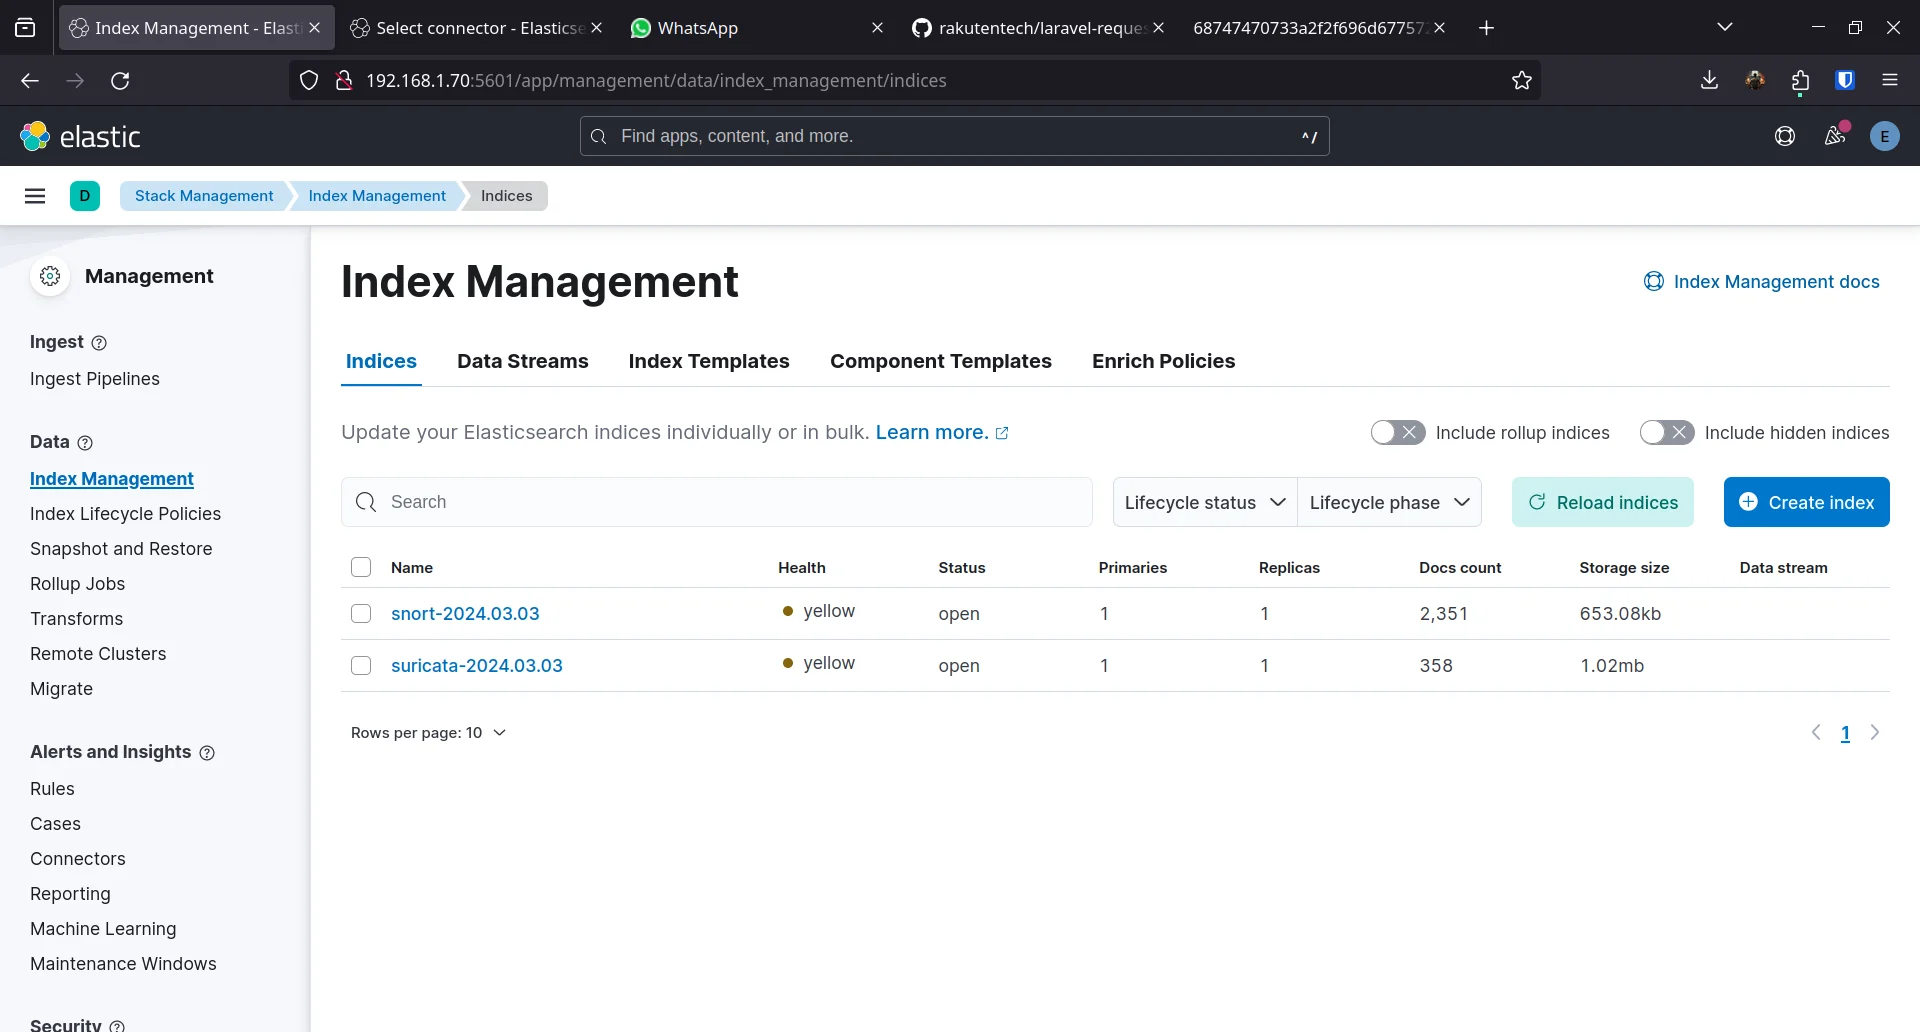
The indexes show up in Elasticsearch:
Kibana Dashboards
Dashboards live under Analytics > Dashboards.

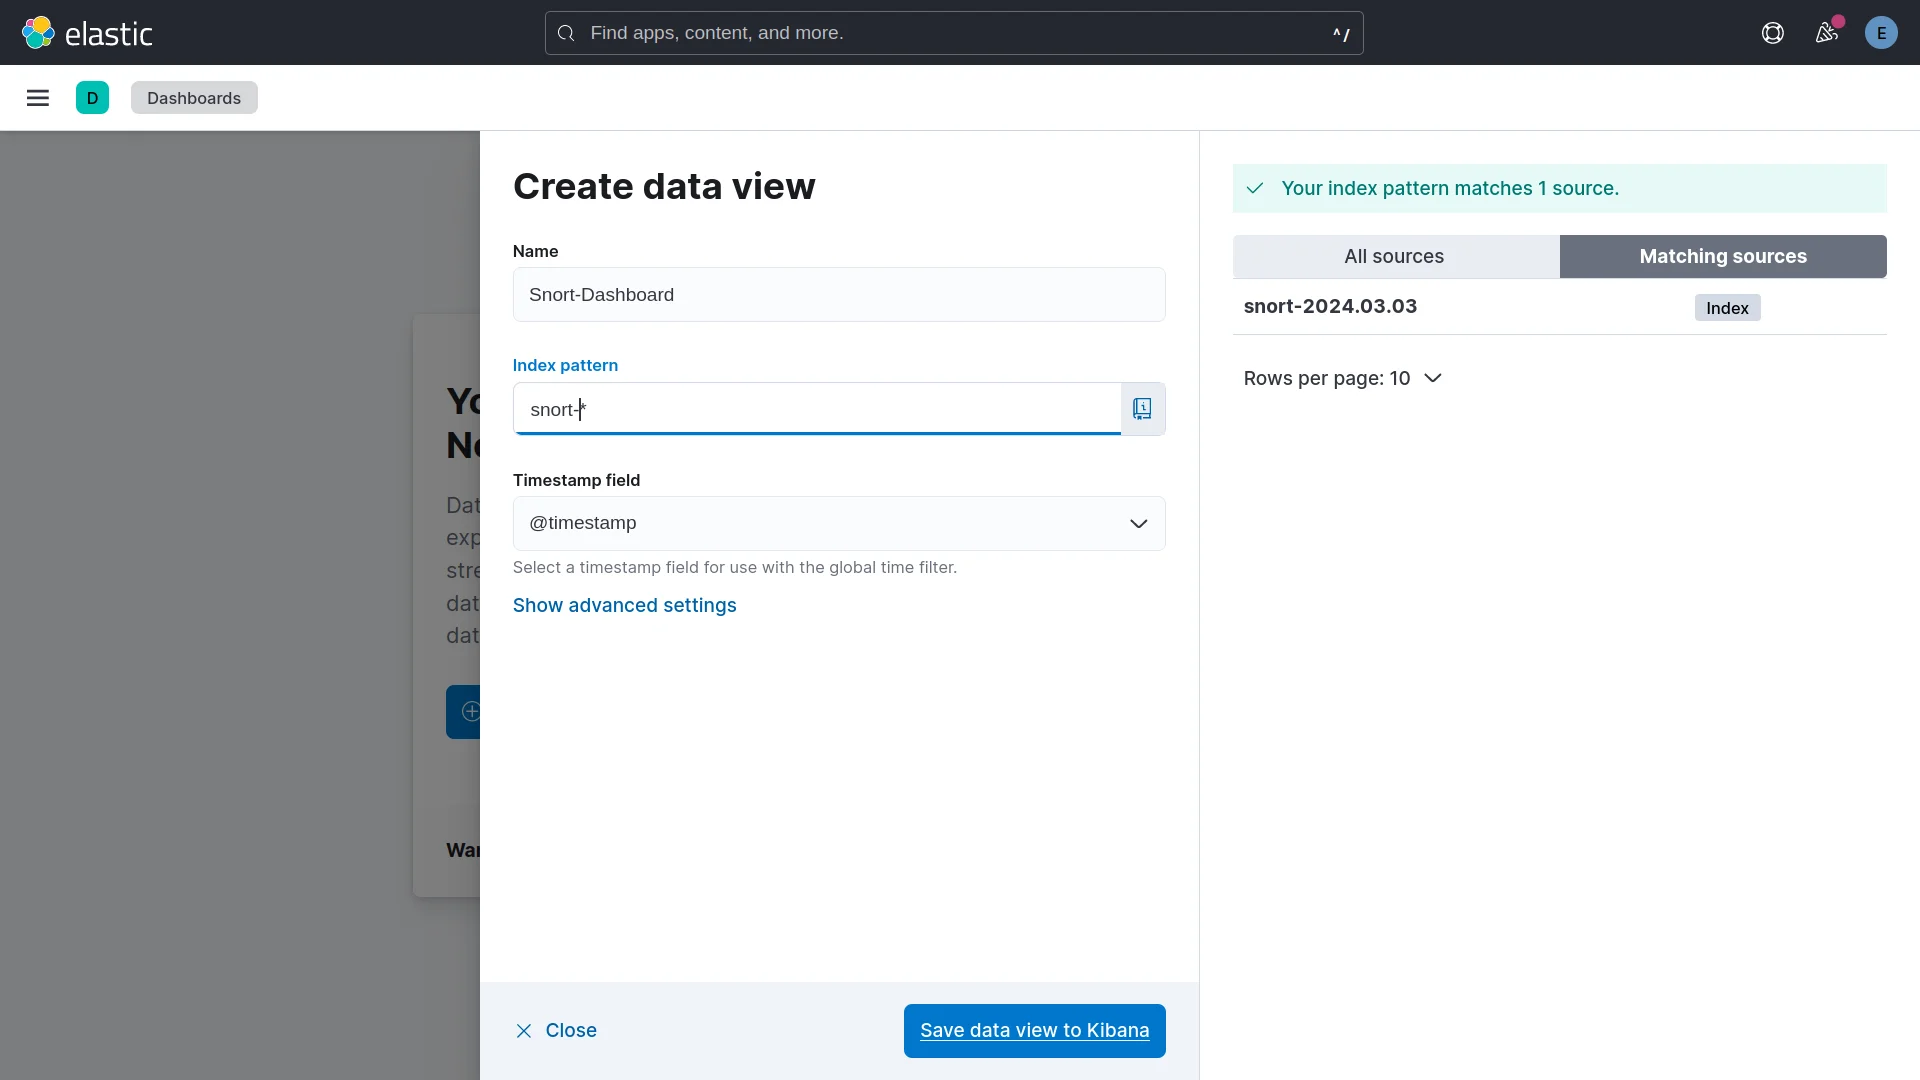
I create a snort-* index pattern so the dashboard picks up every Snort index.
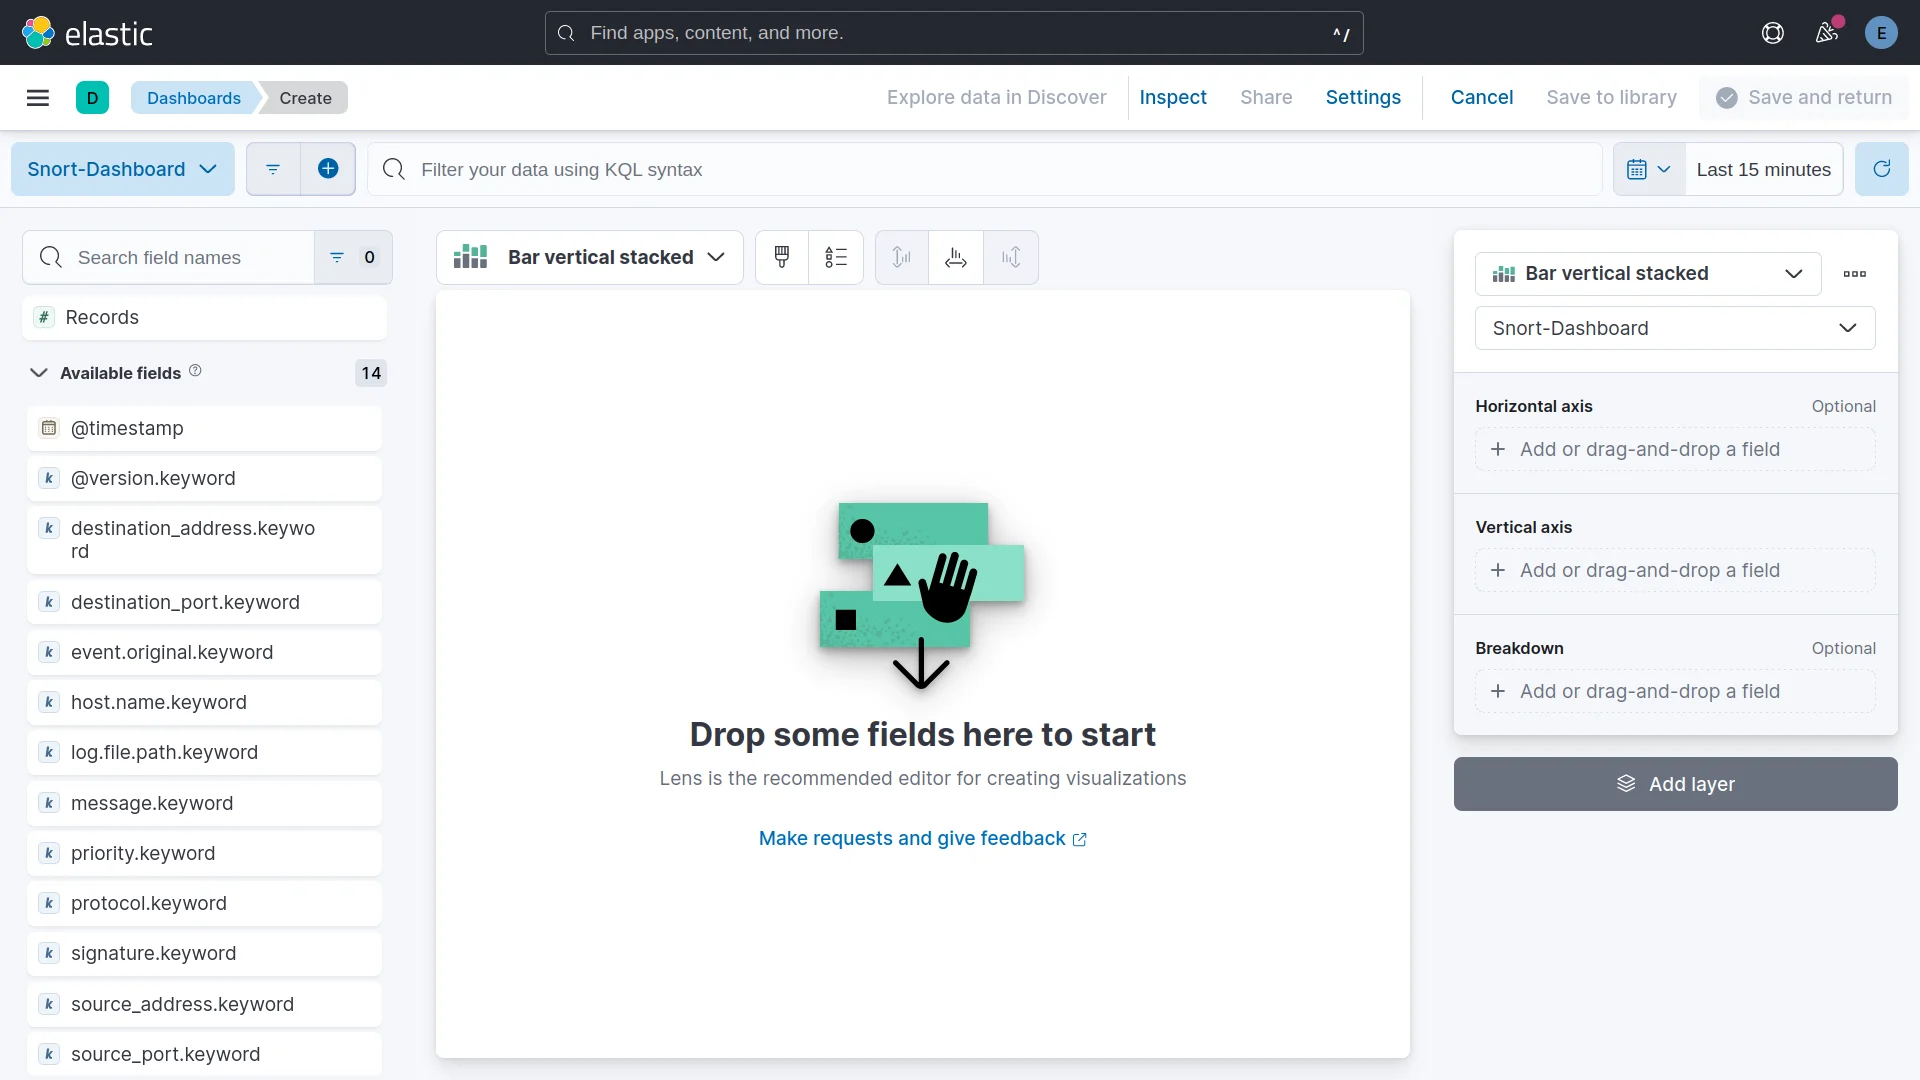
Snort Dashboard
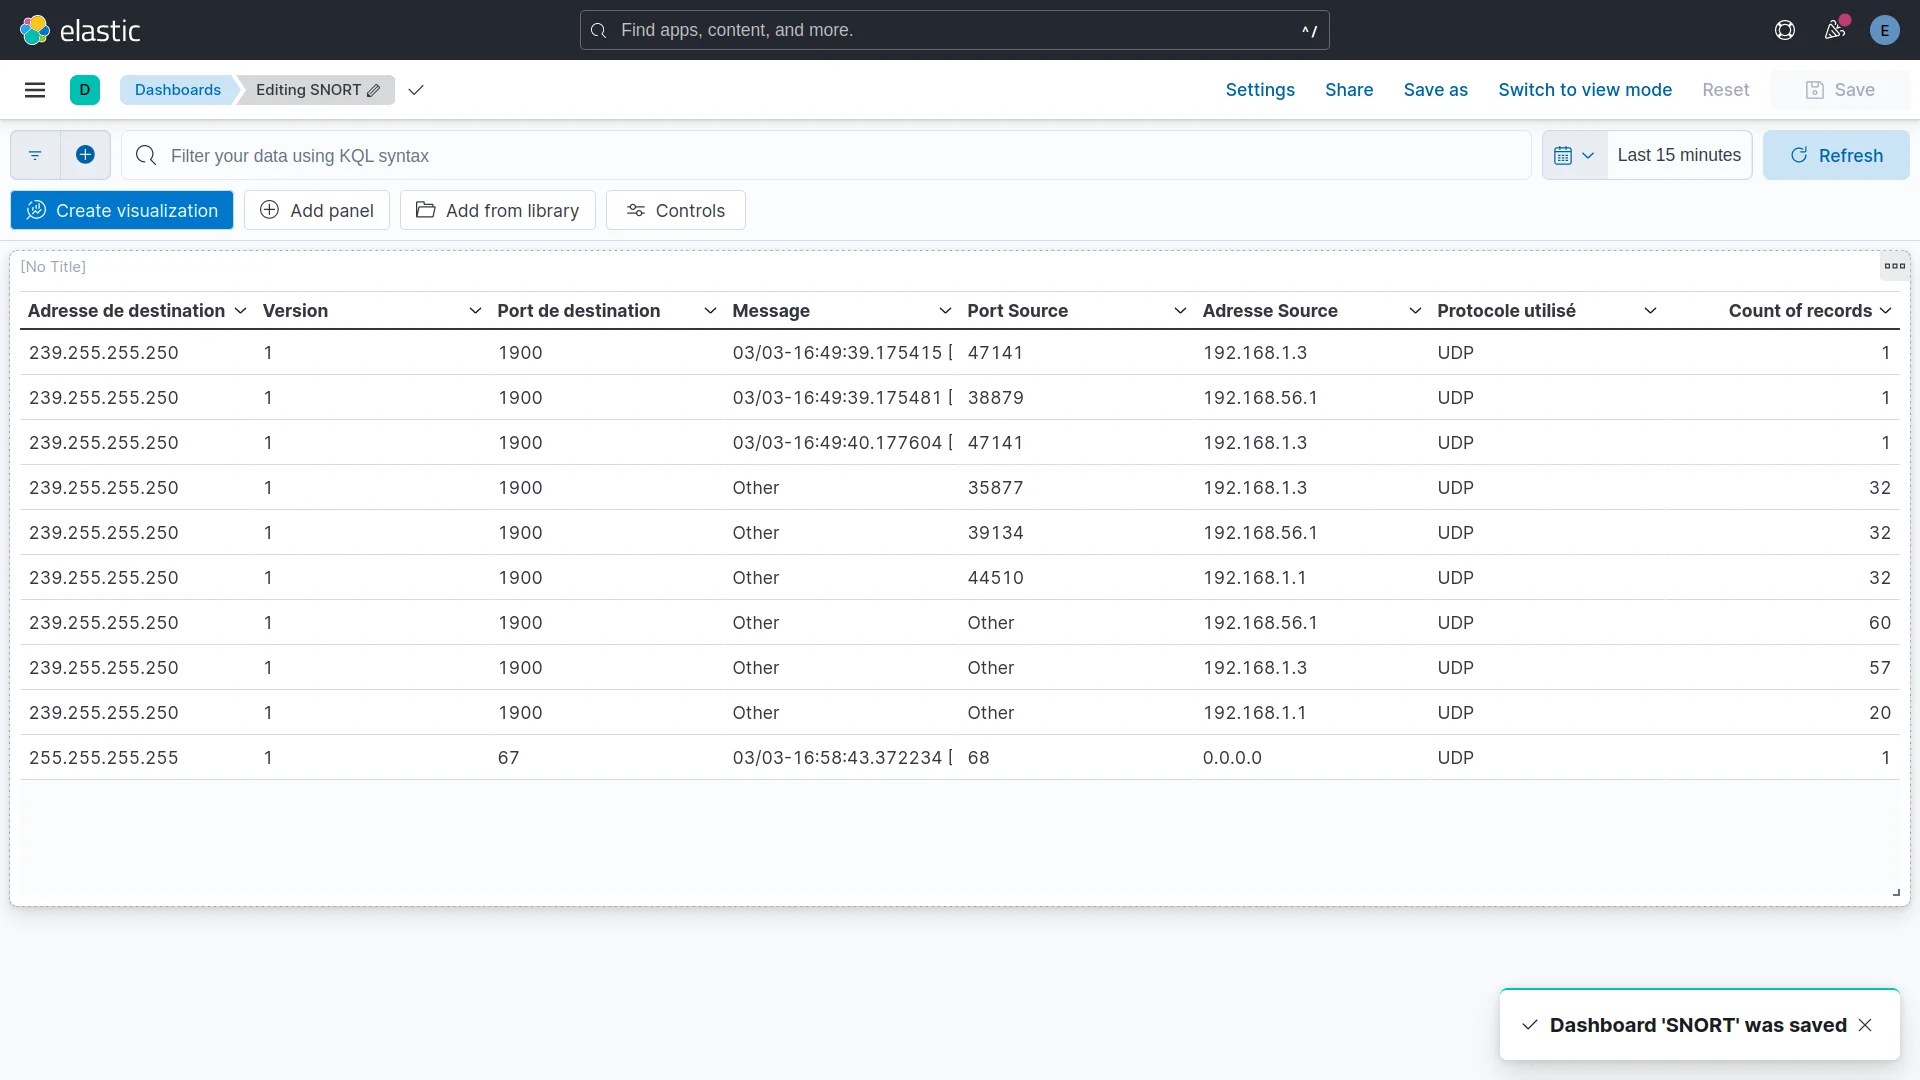
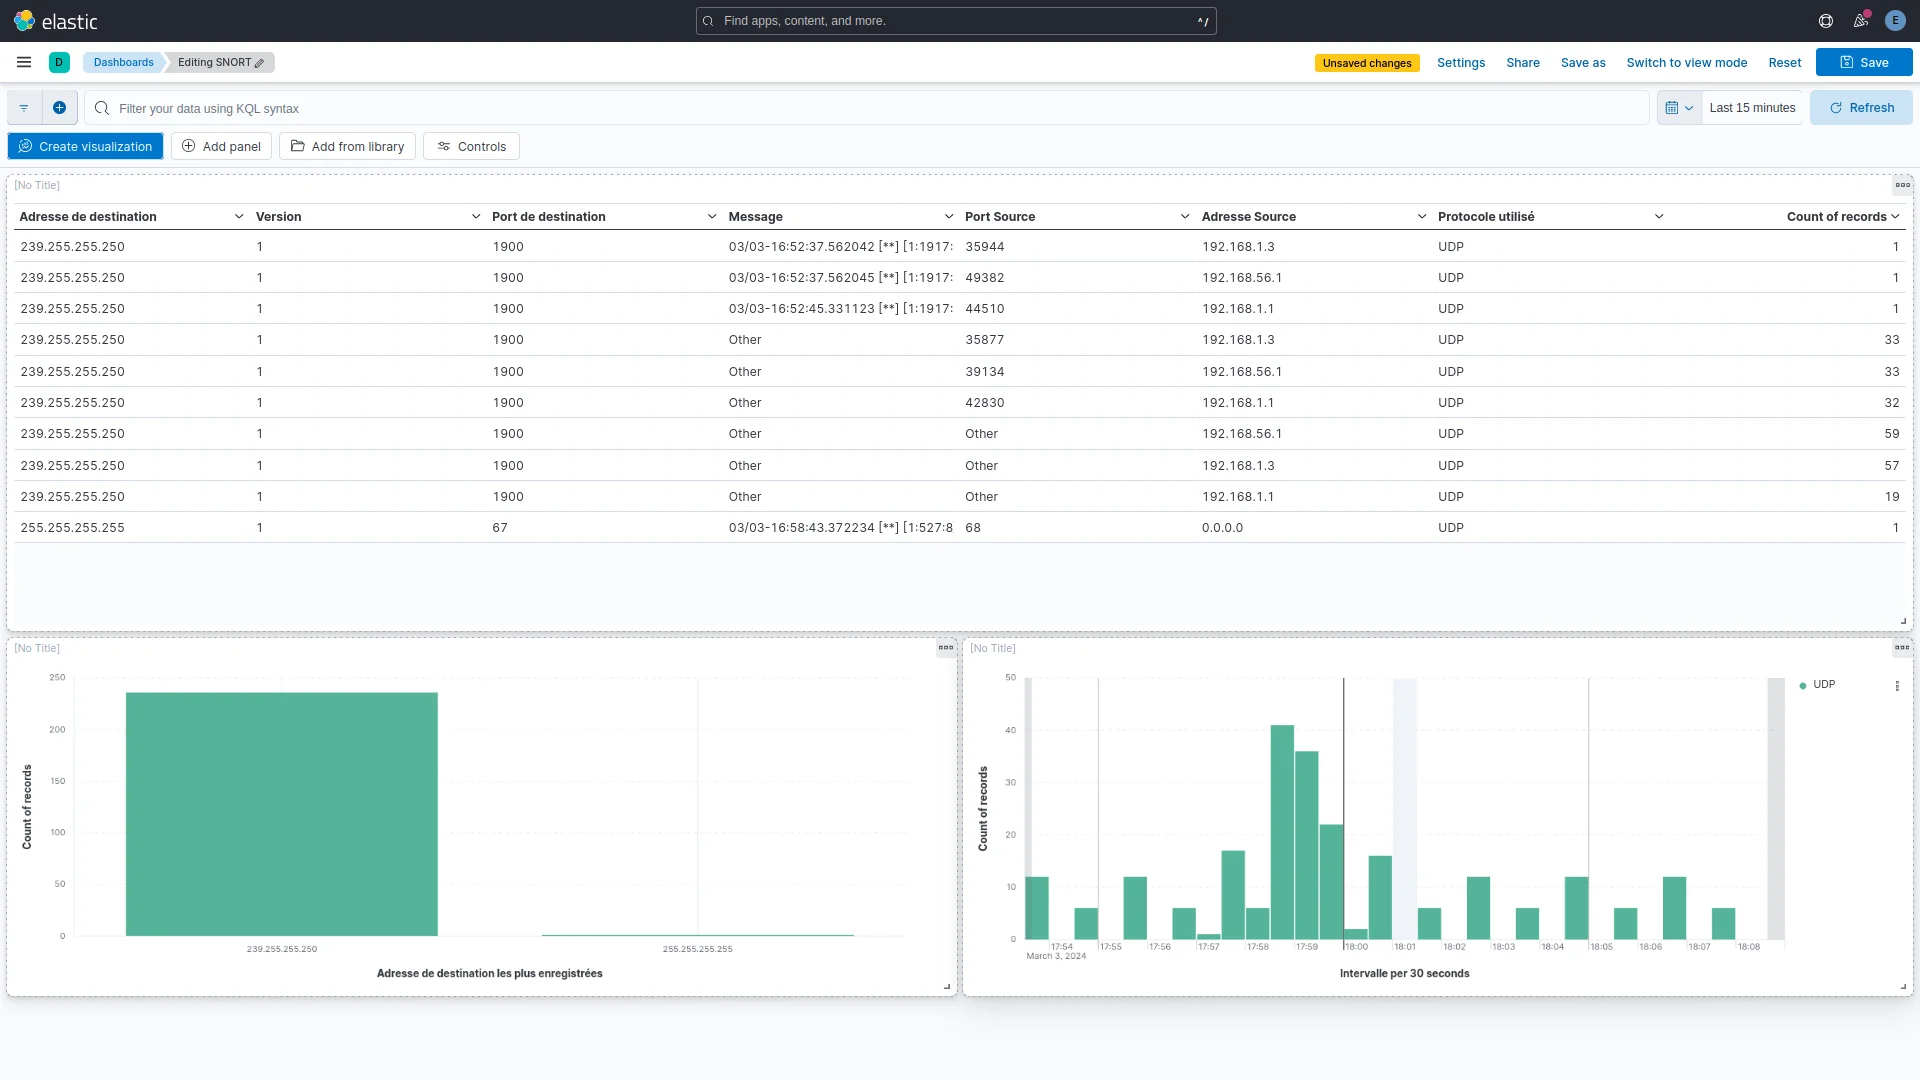
It has a table with the main fields and two charts: most used protocols and most contacted destination addresses.
Suricata Dashboard
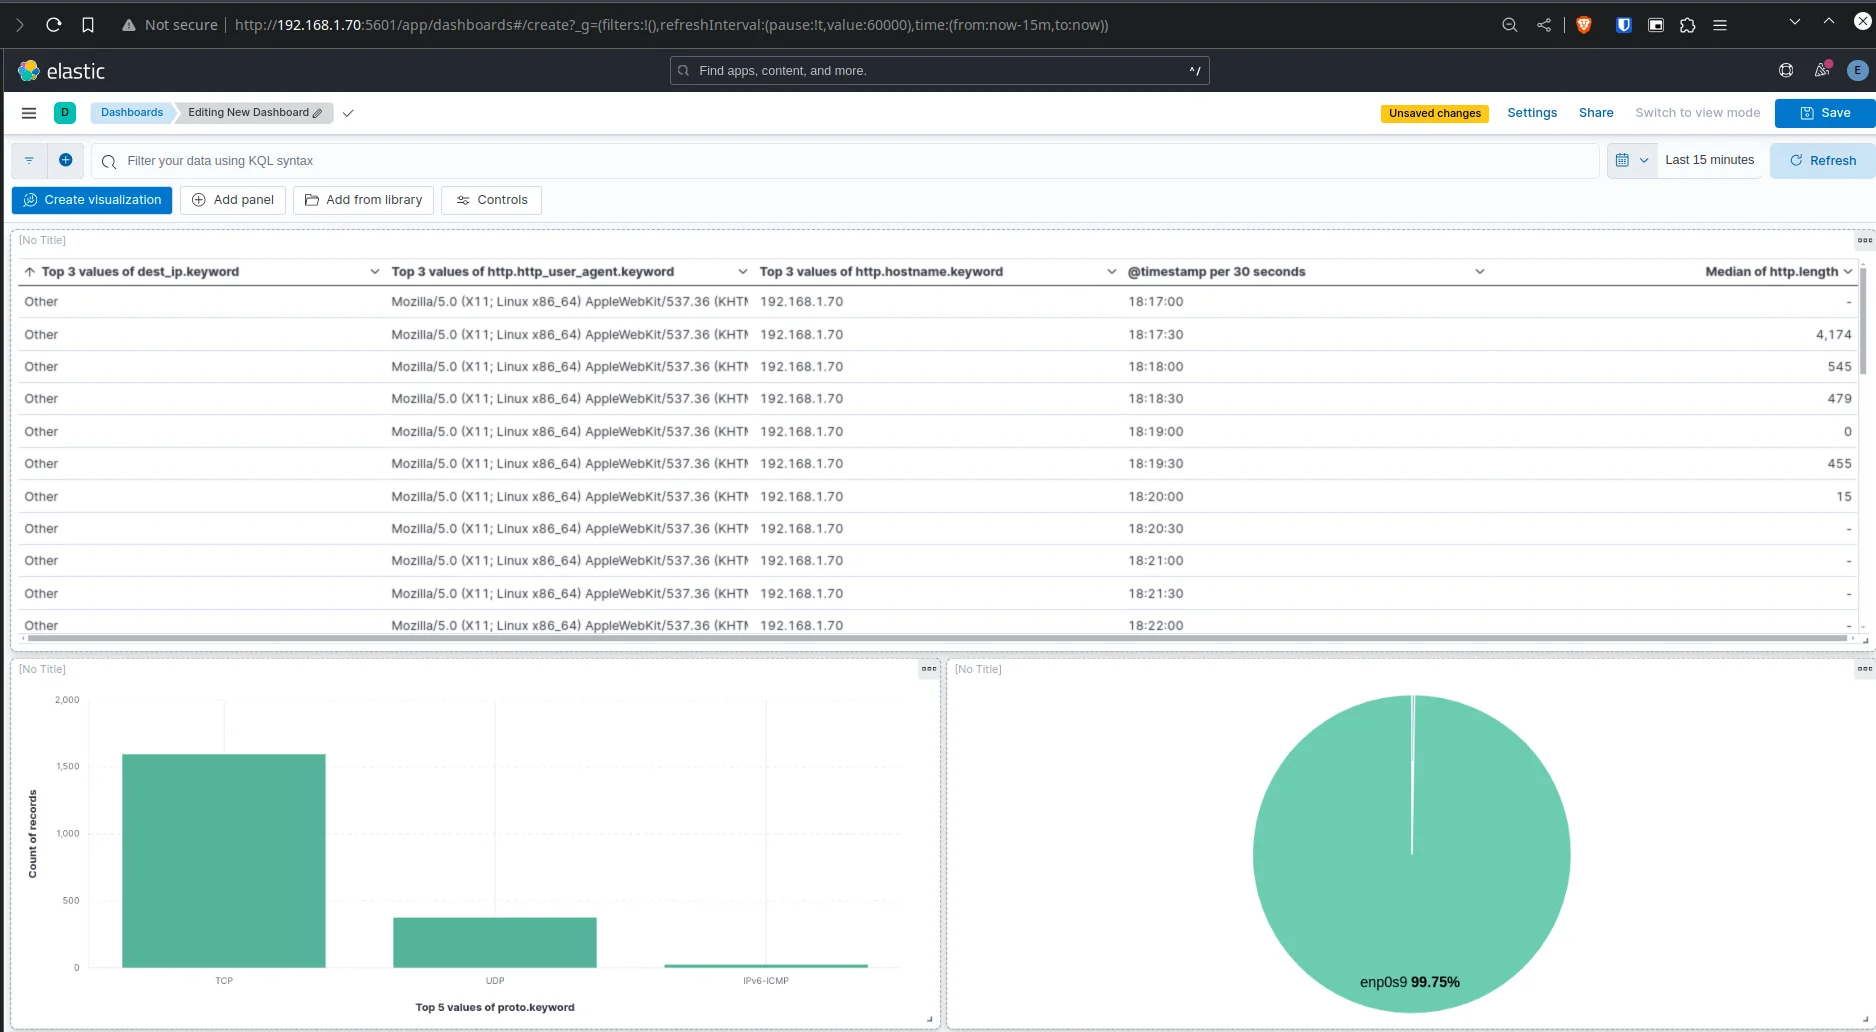
This one gives an overview of network traffic: breakdown by interface, TCP and UDP usage, and a table of user agents with their IPs.
Windows Logs with Winlogbeat
For the Windows machine, I use Winlogbeat. It’s a lightweight Elastic agent that reads Windows events in real time and ships them straight to Elasticsearch.
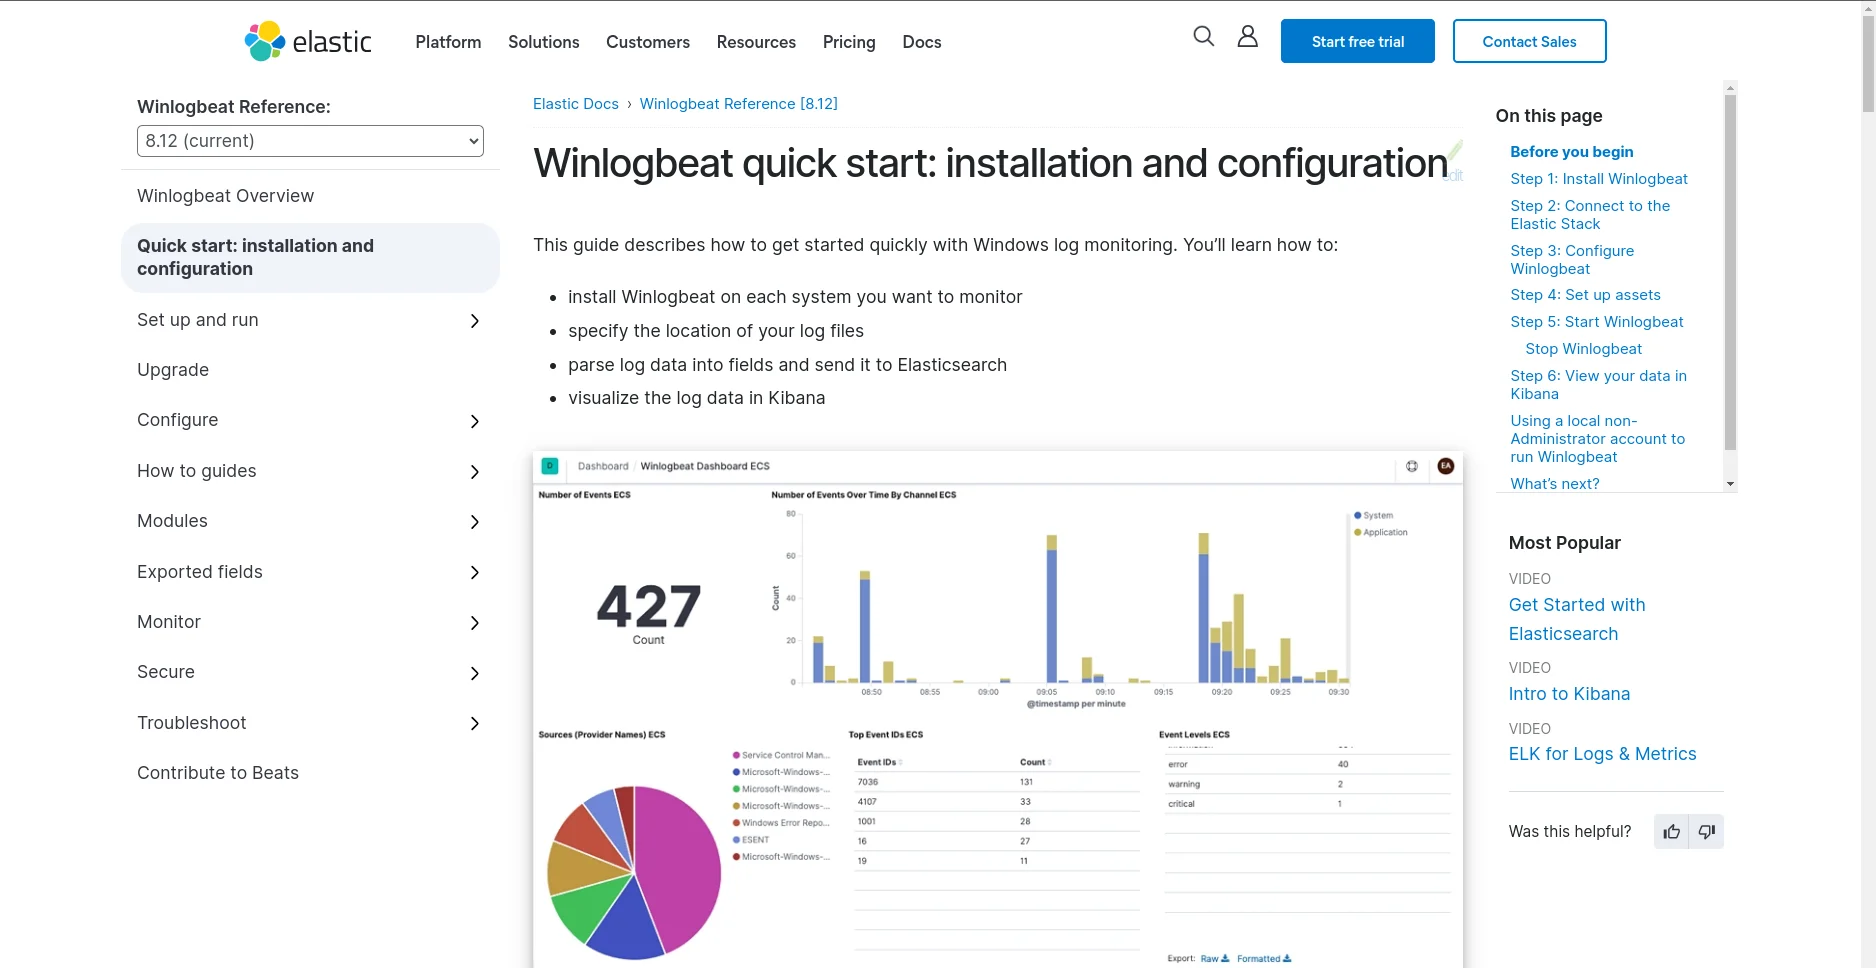
The configuration:
setup.template.name: "winlogbeat"setup.template.pattern: "winlogbeat-*"
winlogbeat.event_logs:  - name: Application    ignore_older: 72h  - name: System  - name: Security  - name: Microsoft-Windows-Sysmon/Operational  - name: Windows PowerShell    event_id: 400, 403, 600, 800  - name: Microsoft-Windows-PowerShell/Operational    event_id: 4103, 4104, 4105, 4106  - name: ForwardedEvents    tags: [forwarded]
setup.template.settings:  index.number_of_shards: 1
setup.kibana:  hosts: ["localhost:5601"]
output.elasticsearch:  index: "winlogbeat-%{[agent.version]}-%{+yyyy.MM.dd}"  hosts: ["192.168.1.70:9200"]  protocol: "https"  username: "elastic"  password: "maybe_secure_password_here ?!"  ssl.certificate_authorities: ["C:\\Users\\vagrant\\Downloads\\winlogbeat-8.12.2-windows-x86_64\\ca.cert"]
processors:  - add_host_metadata:      when.not.contains.tags: forwarded  - add_cloud_metadata: ~
It collects Application, System, Security, Sysmon, and PowerShell logs. I run Winlogbeat from a Windows terminal:
./winlogbeat.exe -c winlogbeat.yml -e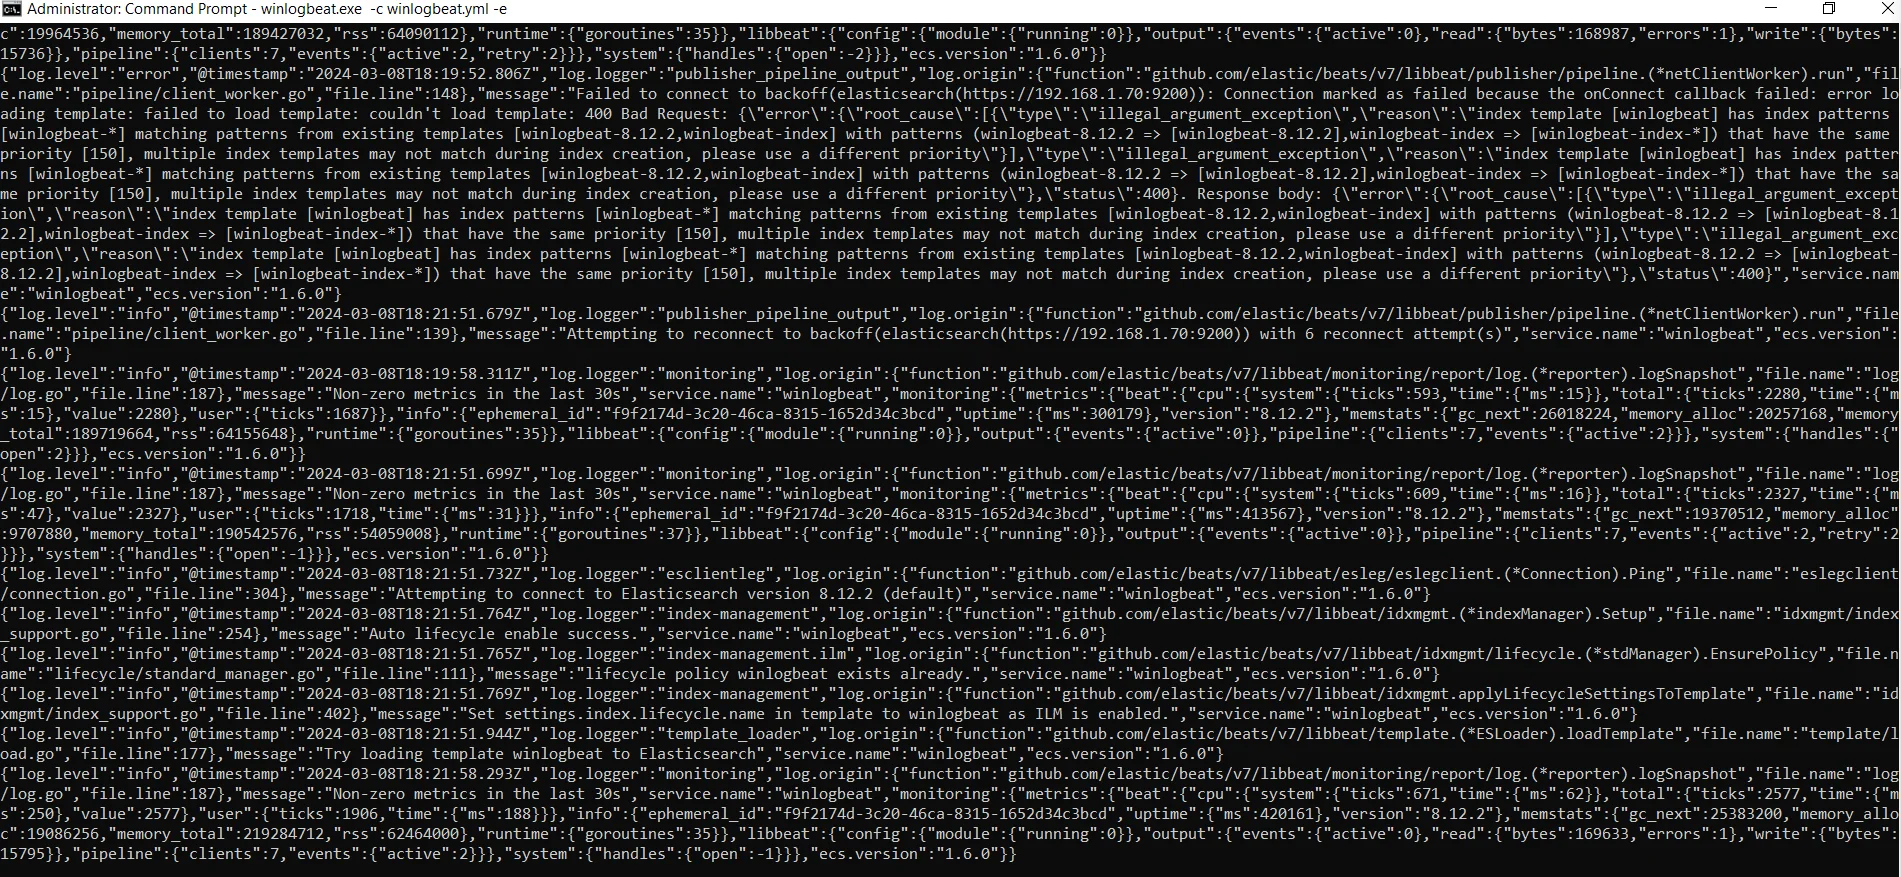
Logs reach Elasticsearch:
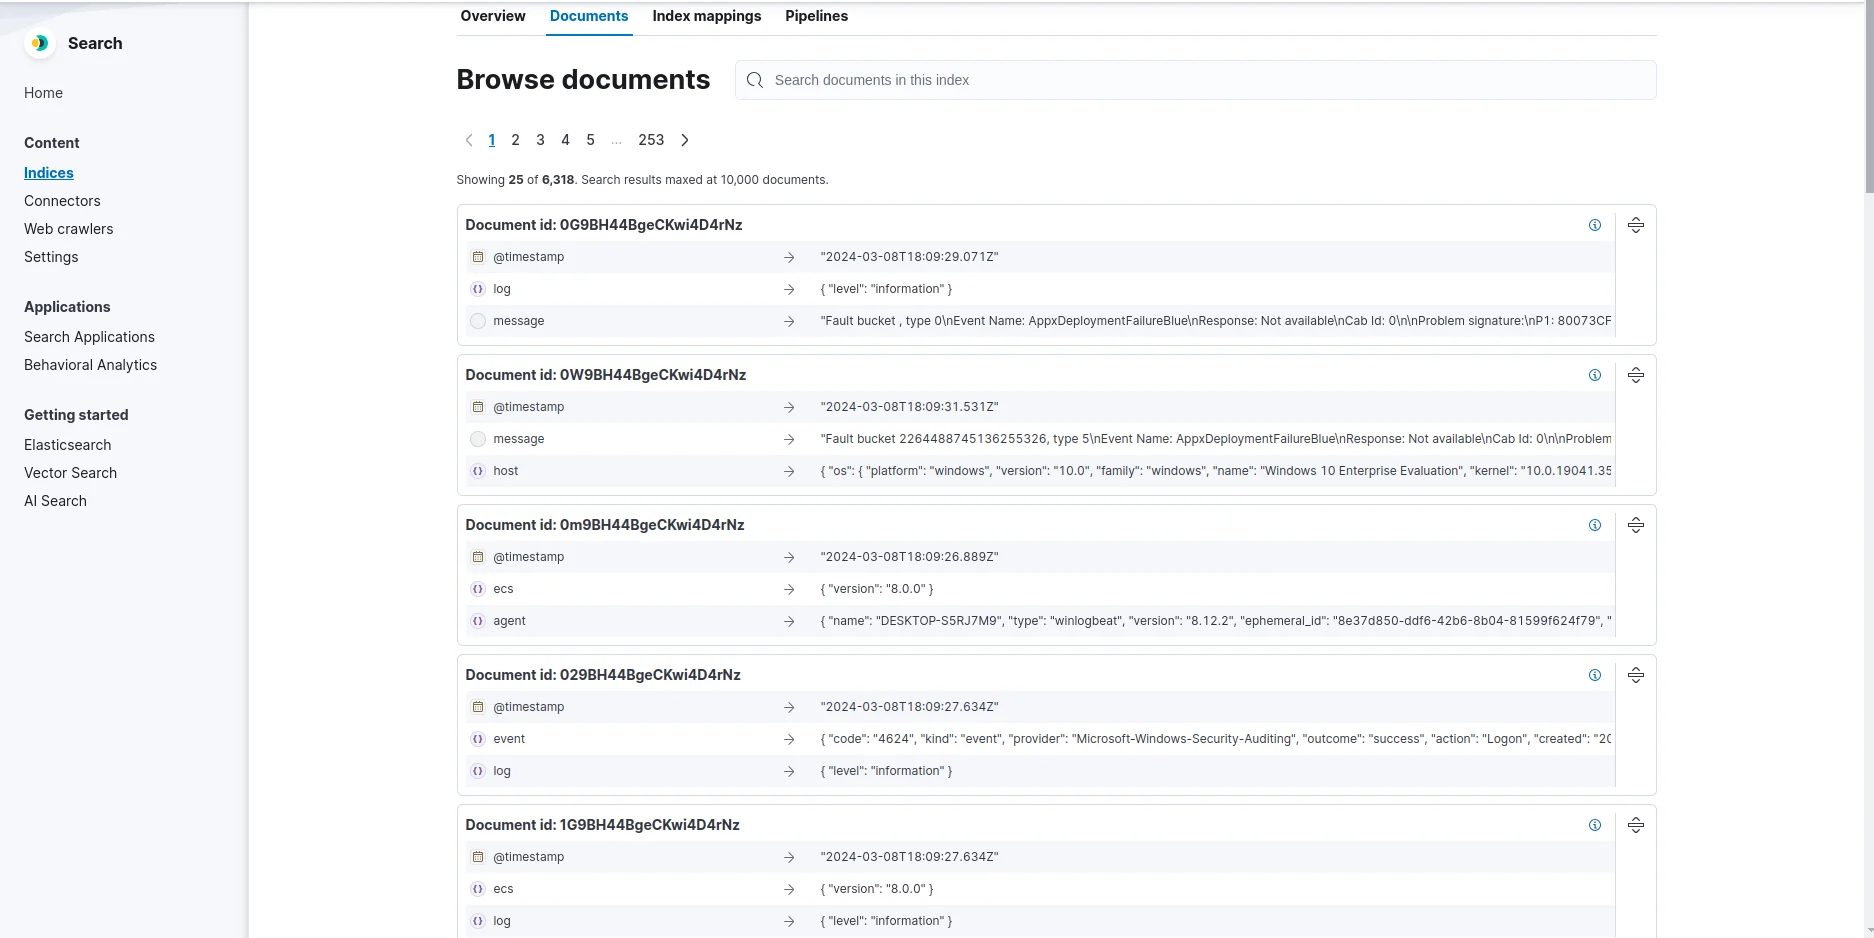
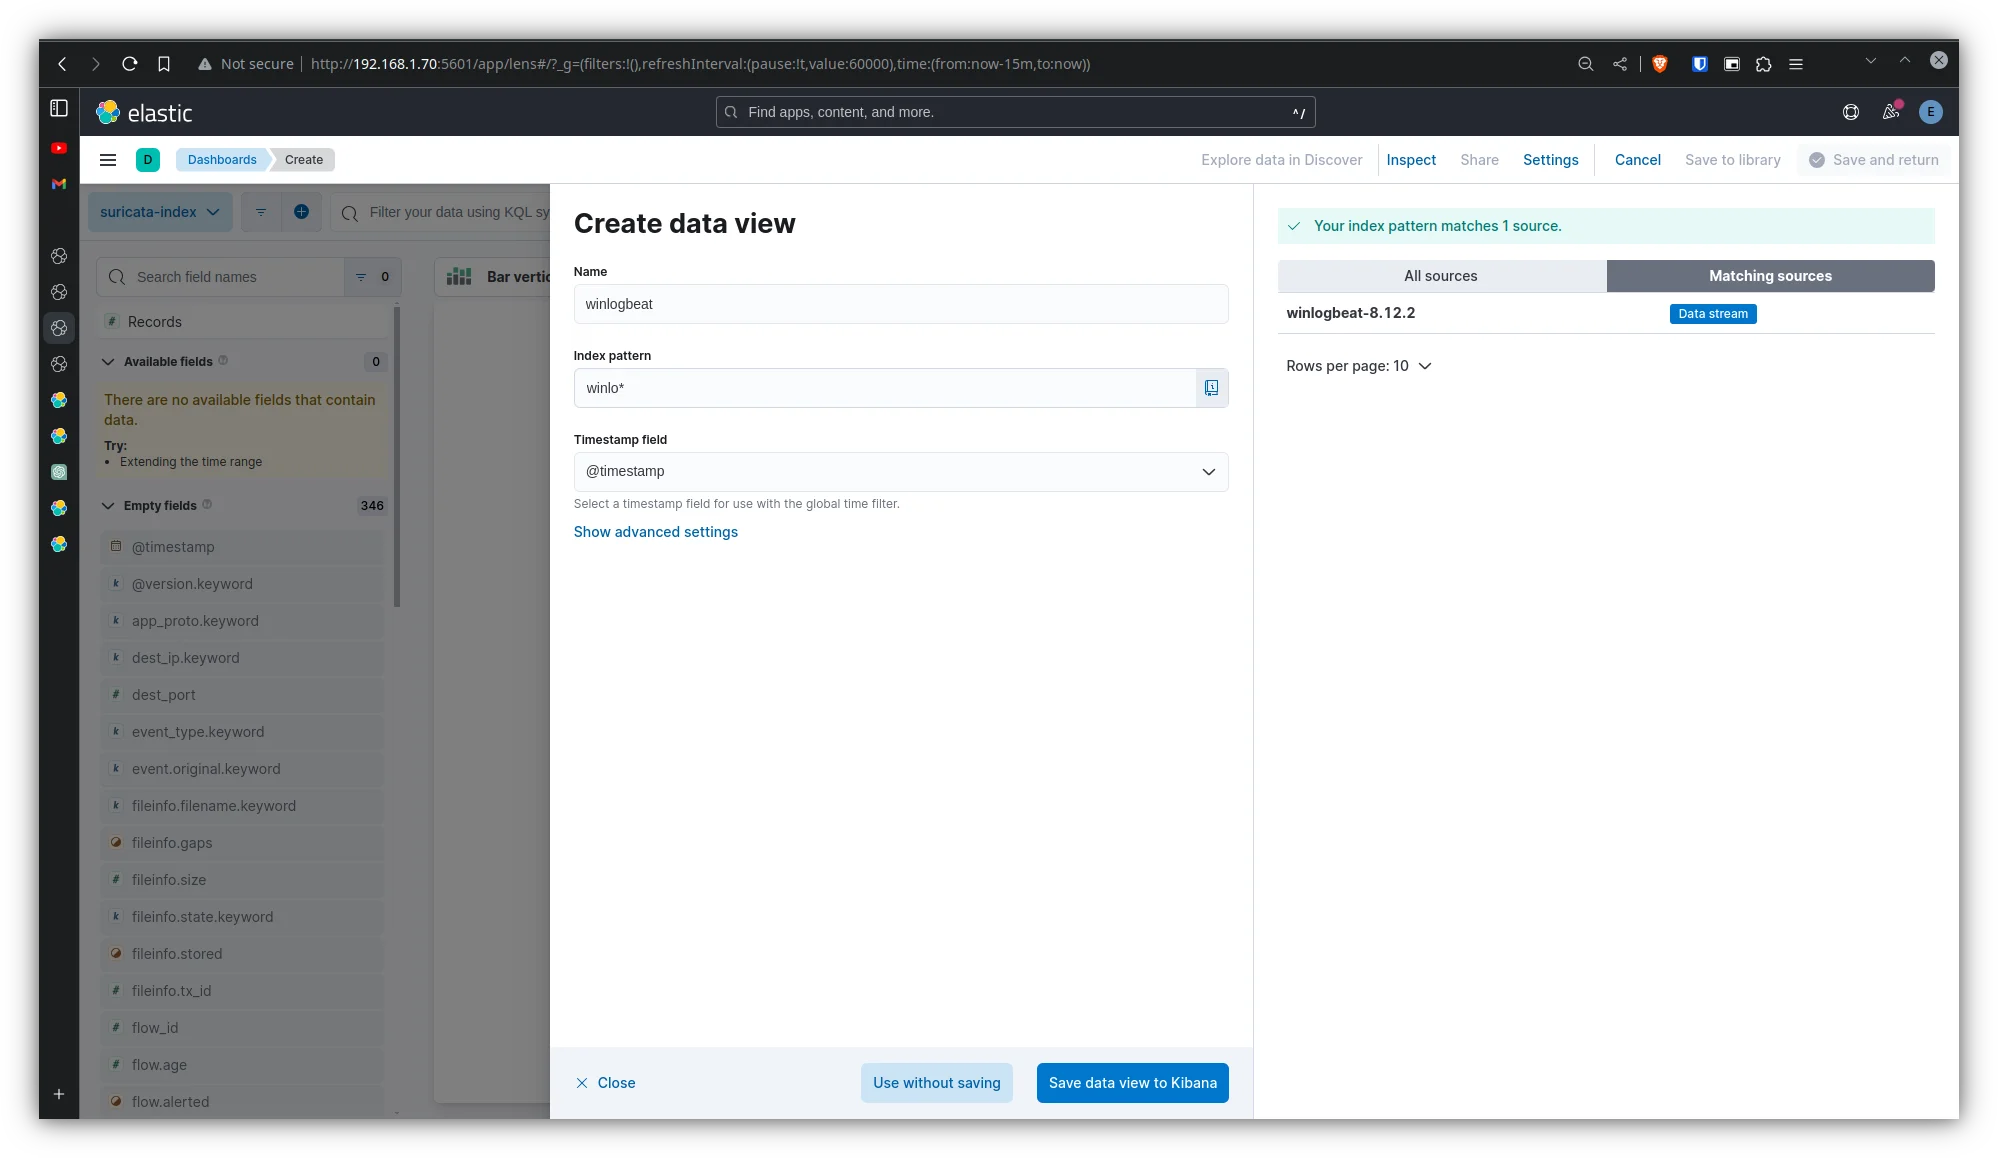
Last step, I add the data source in Kibana to build visualizations:
That’s the whole stack: Snort, Suricata, and Windows events in one place. From here, the next steps are correlating events across sources, setting up alerts, or adding more sources.